Download
1 / 30
420 likes | 1.87k Vues
Facility layout. Activity relationship analysis. REL chart. Flow analysis tends to relate various activities on some quantitative basis (refer Travel chart). Typically, the relationship is expressed as a function of transport cost or material handling cost.

E N D
Facility layout Activity relationship analysis
REL chart • Flow analysis tends to relate various activities on some quantitative basis (refer Travel chart). • Typically, the relationship is expressed as a function of transport cost or material handling cost. • There might be other qualitative aspects of layout design that might be important. • The activity relationship chart (REL chart) was developed to facilitate the consideration of qualitative factors – analytically! • The REL chart replaces the numbers in the Travel chart by a qualitative closeness rating.
REL chart • All pairs of relationships are evaluated, and a closeness rating (A, E, I, O, U, and X) is assigned to each pair. • When evaluating activity relationships for N activities, there are N(N-1)/2 such evaluations. • With the exception of U rating, the reason for the assigned rating is indicated using a numeric code. • Closeness ratings represent an ordered preference for “closeness.” • Specifically, A and X ratings are considered to be most important ratings. • Hence, any layout must satisfy A and X ratings. • Thus, A and X > E > I > O > U , where > means “more important or higher ranking than.”
REL chart A: Absolutely necessary E: Especially important I: Important O: Ordinary closeness OK U: Unimportant X: Undesirable
REL chart • Assignment of the closeness rating is subjective. Rule of thumb: • Very few A and X relationships should be assigned. (no more than 5% of the closeness ratings to be an A and X). • No more than 10% should be an E. • No more than 15% to be an I. • No more than 20% to be an O. • Which means that about 50% of the relationships should be U.
Hierarchical approach • Block plans, or block layouts are developed first by determining the sizes, shapes and relative locations of departments or other designated activities. • Next, detailed layouts are designed for each department. • Thus different REL charts are needed for designing block plans and detailed layouts. • The process of constructing an activity relationship chart can be complicated by the presence of multiple relationships that will influence the design of the layout.
REL chart – REL diagram • From REL chart, we construct activity relationship diagram (REL diagram). • The purpose is to depict spatially the relationships of the activities. • The basic premise is that geographic proximity can be used to satisfy particular relationships. • For example, when the activity relationships reflect the magnitudes of material flows, pairs of activities having the greatest pair wise flow are located next to each other. • Similarly, pairs of activities having an A rating are located adjacently.
Graph based process • Each activity is represented by a circle, node or vertex. • Activities that must be adjacent are denoted by connecting the respective nodes or vertices with lines, links or edges. • The resulting representation of the activities and relationships is the activity relationship diagram or graph. • A graph is planar if it can be drawn so that its vertices are points in the space and each edge can be drawn such that it intersects no other edges and passes through no other vertices. • A requirement for the existence of a layout satisfying the activity relationships depicted in the graph is that the graph be planar.
Graph based process • Regions defined by a graph are referred to as faces; with the unbounded outside region is the exterior face. • Two faces are said to be adjacent if they share a common edge. • An additional aspect of a graph is its dual. • To construct the dual of a planar graph, place a dual node in each face of the primal graph. • Whenever two faces are adjacent in primal, connect the corresponding dual nodes by an edge such that it crosses the edge that divides the primal faces. • If the REL diagram is a planar graph, its dual graph will be planar.
Graph based process • It is not a simple matter to establish the planarity of a graph for a reasonably large layout problem. • Computer codes do exist for establishing the same though. • More importantly, upper bound exists on the number of pairs of adjacent activities. • If there are N activities, no more than 3N-6 pairs of activities can be adjacent. • That is, if the graph of adjacency relationships has more than 3N-6 edges, it cannot be planar. • However, this is an upper bound. Examples can be constructed such that non-planarity results with less number of adjacent activities considered.
Graph based process • If at least half of the relationships are U ratings, then for planarity to exist, the upper bound places the following limitations on the number of activities: • Hence if more than 10 departments are involved, planarity will not exist if all A, E, I, and O relationships must be satisfied via adjacency.
Graph based process • Therefore, for large problems, if adjacency is the basis of satisfying closeness requirements, it might be that only A, or A and E, relationships can be satisfied. • If the distribution of closeness rating is 5% A, 10% E, 15% I, and 20% O, then as many as 118 departments can be accommodated if only A relationships must be satisfied via adjacency. • However, if A and E relationships are to be satisfied via adjacency, no more than 38 departments can be accommodated. • Similarly, to include A, E, and I relationships, only 18 departments can be fit.
Graph based process In summary, • The graph based approach provides a structured approach for developing the REL diagram. • Graph based approach is widely used in activity-based block layouts. • It emphasizes the importance of constructing a planar graph of the REL chart if the block diagram is to be constructed to satisfy the relationships.
Graph based process Limitations • Interpretation of closeness to mean adjacency. This, at times, results in peculiar shapes of departments to satisfy adjacency requirements. • There is no well-defined algorithm to draw a planar graph. • Planarity requirement is a limitation: Just because a set of requirements can not be satisfied via a planar graph does not mean that a block layout cannot be developed. It only means that it is not possible to satisfy all relationships with adjacency.
Designing a layout • After the block layout is ready, estimate is made of the space requirements. • This includes space required for machines, equipments, products. • Estimation of human resources needed is made based on the number of machines operated and production rate. • Then, space relationship diagrams are made.
Use of computers in layout design • Many Systematic Layout Planning (SLP) commercial software packages available. Examples: • CRAFT • CORELAP • ALDEP • PLANET • Originally developed in late 60’s, many of these packages are still around.. with latest additions to the features!
Layout design • It has to be noted that if the “favorable” factors don’t lend themselves for quantification, it is very difficult to calculate the utility of a layout using a computer software. • How do you measure “flexibility” of a layout against another? • So some form of quantifiable function is used in most of the algorithms.
Adjacency-based rating • The layout score is computed as: where, Xi is the number of adjacencies in class i, and wi is the weighting factor for class i. • Typical weights: A (64), E(16), I(4), O(1), U(0) and X(-1024) • Larger the score, better is the layout.
Distance-based scoring • The scoring model for m activities: Cij is the cost per unit distance of flow between activities i and j. (same as i-to-j and j-to-i) Dij is the distance between activities i and j.
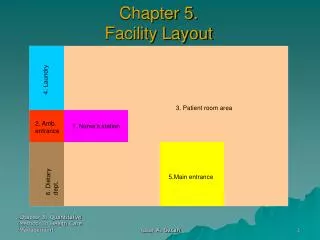
Process layout and relative location problem • Arrangement by similar processes grouping. • Can simultaneously handle a wide variety of services. • Give flexibility in equipment use and in employee assignment. • Downside: customer has to travel more than in product layout. e.g. Law offices, banks, amusement parks etc. • Key to a good layout: arrange departments or service center depending the flow of customers and travel time between the pair of departments. • Pair-wise switching algorithm is one of the methods to solve this problem.
Objective of process layout algorithm • Objective function • Instead of distance, it could be time taken or cost of movement.
Example: pair-wise switching algorithm Transportation cost of Re. 1 for adjacent departments and Cost of Rs. 2 for nonadjacent departments
Pair-wise switching algorithm • Cost of the default layout = 50+2*100+2*20+30+50+10+2*20+100+50 = Rs. 570 • Cost of new layout = 50+100+20+2*30+50+10+2*20+100+50 = Rs. 480