Download
1 / 14
140 likes | 318 Vues
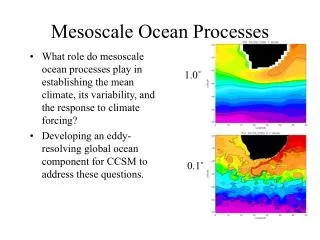
Using Data to Explore Ocean Processes. Koshland Science Museum of the National Academy of Sciences. +. CTD. Niskin Bottles. C onductivity T emperature D epth . 10m. 75m. 125m. Fluorescence 0 0.1 0.2 0.3 04 0.5 0.6 0.7 0.8 0.9 1.0.

E N D
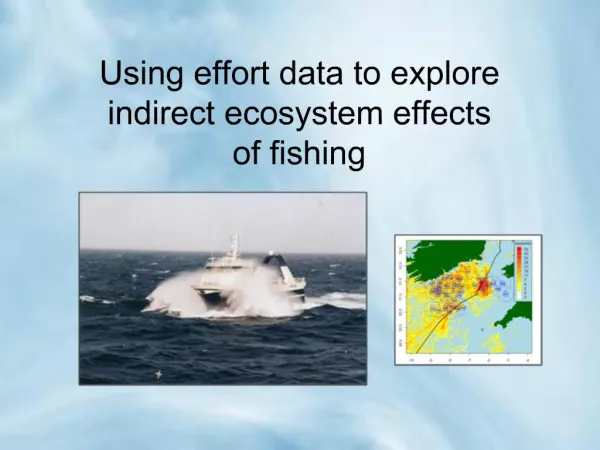
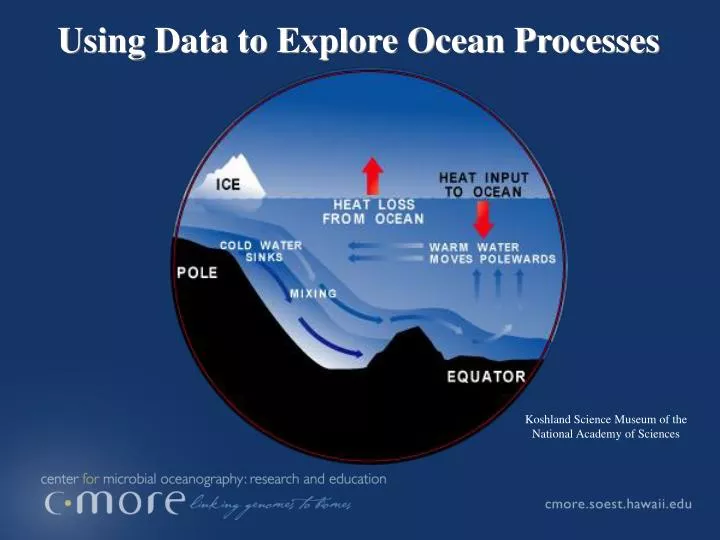
Using Data to Explore Ocean Processes Koshland Science Museum of the National Academy of Sciences
+ CTD Niskin Bottles Conductivity Temperature Depth
10m 75m 125m
Fluorescence 0 0.1 0.2 0.3 04 0.5 0.6 0.7 0.8 0.9 1.0 Temperature (ITS-90) 0 5 10 15 20 25 30 0 200 400 600 800 1000 Depth (m) 34 .0 34.25 34.50 34.75 35.0 35.25 35.5 Salinity (PSU) 0 25 50 75 100 125 150 175 200 225 250 Oxygen uMol/kg
Photosynthesis CO2 Carbon dioxide + H2O Water + nutrients e.g., nitrate, phosphate + O2 Oxygen Organic carbon Organic carbon Respiration and Decomposition CO2 + Carbon dioxide H2O + Water nutrients e.g., nitrate, phosphate + O2 Oxygen
Marine Nitrogen Cycle Nitrogenous base
Grazing Photosynthesis Respiration or Death Inorganic Nutrients (NO3, PO4) Dissolved Organic Matter e.g., ATP, lipids, sugars, proteins
Long-term Oceanographic Research • Hawaii Ocean Time-series (HOT) • Started in October 1988 • Scientists measure a wide range of variables in the Pacific Ocean
Time (year) Horizontal Profiles Time-series Bottle
Let’s change the grouping Highest oxygen during the spring Oxygen peak in 1991 Horizontal Profiles Time-series Bottle
Summary • Scientists use technology, like CTDs, to study the ocean. • Phytoplankton play important roles in food production and chemical cycling. • Time-series are valuable for understanding large-scale ocean processes.