Download
1 / 35
360 likes | 730 Vues
Behavioral Graph Coloring. Michael Kearns Computer and Information Science University of Pennsylvania Collaborators: Nick Montfort Siddharth Suri Special Thanks: Colin Camerer, Duncan Watts, Huanlei Ni. Background and Motivation. Network Structure Influences Dynamics and Behavior

E N D
Behavioral Graph Coloring Michael Kearns Computer and Information Science University of Pennsylvania Collaborators: Nick Montfort Siddharth Suri Special Thanks: Colin Camerer, Duncan Watts, Huanlei Ni
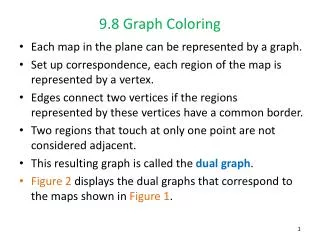
Background and Motivation • Network Structure Influences Dynamics and Behavior • sociology, economics, computer science, biology… • network universals and generative models • empirical studies: network is given • Navigation and the Six Degrees • Travers&Milgram Watts, Kleinberg • distributed all-pairs shortest paths • what about other problems? • Behavioral Economics and Game Theory • human rationality in the lab • This Work: • human subject experiments in distributed graph coloring • controlled variation of network structure (and other variables) • CS + SNT + BGT
(Behavioral) Graph Coloring solved not solved • Undirected graph; imagine a person “playing” each vertex • Finite vocabulary of colors; each person picks a color • Goal: no pair connected by an edge have the same color • Computationally well-understood and challenging… • no efficient centralized algorithm known (exponential scaling) • strong evidence for computational intractability (NP-hard) • even extremely weak approximations are just as hard • …Yet simple and locally verifiable
The Experiments: Overview • Designed and built a system for distributed graph coloring • Designed specific sequence of experiments • Obtained human subjects review (IRB) approval • Recruited human subjects (n = 38) • Ran experiments!
Experimental Design Variables • Network Structure • six different topologies • inspired by recent generative models • Information View • three different views • Incentive Scheme • two different mechanisms • Design space: 6 x 3 x 2 = 36 combinations • Ran all 36 of them
Small Worlds Family Simple Cycle 5-Chord Cycle 20-Chord Cycle Preferential Attachment, n= 2 Preferential Attachment, n = 3 Leader Cycle
Collective incentives: • all 38 participants paid if and only if entire graph is properly colored • payment: $5 per person for each properly colored graph • a ``team’’ mechanism • Individual incentives • each participant paid if they have no conflicts at the end of an experiment • payment: $5 per person per graph • a ``selfish’’ mechanism • Minimum payout per subject per session: $0 • Maximum: 19*5 = $95
Research Questions • Can large groups of people solve these problems at all??? • What role does network structure play? • information view, incentives? • Behavioral heuristics?
The Experiments: Some Details • 5 minute (300 second) time limit for each experiment • Population demographics: Penn CSE 112 students • Handout and intro lecture to establish understanding • Intro and exit surveys • No communication allowed except through system • Experiments performed Jan 24 & 25, 2006 • Spring 2005: CSE 112 paper & pencil face-to-face experiments • Sep 2005: system launch, first controlled experiments • Jan 24 session: collective incentives; Jan 25 session: individual incentives • Randomized order of 18 experiments within each session • First experiment repeated as last to give 19 total per session
31 of 38 experiments solved • mean completion time of solved = 82s • median = 44s • exceeded subject expectations (52 of 76)
Small Worlds Family Simple Cycle 5-Chord Cycle 20-Chord Cycle Preferential Attachment, n = 2 Preferential Attachment, n = 3 Leader Cycle
smaller diameter better performance • preferential attachment harder than cycle-based
Algorithmic Introspection(Sep 2005) Prioritize color matches to high degree nodes. That is, I tried to arrange it so that the high degree nodes had to change colors the least often. So if I was connected to a very high degree node I would always change to avoid a conflict, and vice versa, if I was higher degree than the others I was connected to I would usually stay put and avoid changing colors. [many similar comments] Strategies in the local view: I would wait a little before changing my color to be sure that the nodes in my neighborhood were certain to stay with their color. I would sometimes toggle my colors impatiently (to get the attention of other nodes) if we were stuck in an unresolved graph and no one was changing their color. Strategies in the global view: I would look outside my local area to find spots of conflict that were affecting the choices around me. I would be more patient in choices because I could see what was going on beyond the neighborhood. I tried to solve my color before my neighbors did. I tried to turn myself the color that would have the least conflict with my neighbors (if the choices were green, blue, red and my neighbors were 2 red, 3 green, 1 blue I would turn blue). I also tried to get people to change colors by "signaling" that I was in conflict by changing back and forth. If we seemed to have reached a period of stasis in our progress, I would change color and create conflicts in my area in an attempt to find new solutions to the problem. When I had two or three neighbors all of whom had the same color, I would go back and forth between the two unused colors in order to inform my neighbors that they could use either one if they had to.
Summary • Human groups can solve rather complex coloring problems • including from very limited, local information • Network structure has clear effects • within cycle-based family, solution time decreases with diameter • preferential attachment appears considerably harder • More information helpful for cycle-based, harmful for preferential attachment • Individuals adopt sensible and natural heuristics • Inverse dependence of activity on degree • Inverse dependence of resolution fraction on degree • Relative amount of conflict per color • Signaling • Injection of “randomization” to escape local minima
Future Work • More experiments! • repeats of current experiments • wider variety of graph topologies • larger subject pools • controlled vs. web-based • approximations and the behavioral price of anarchy • Imposed vs. “natural” network structure • Richer communication channels • Learning • Other optimization problems • ???