Download

1 / 93
1.09k likes | 1.63k Vues
Shock. Scott G. Sagraves, MD, FACS Assistant Professor Trauma & Surgical Critical Care Associate Director of Trauma UHS of Eastern Carolina. Objectives. Define & classify shock Outline management principles Discuss goals of fluid resuscitation

E N D
Shock Scott G. Sagraves, MD, FACS Assistant Professor Trauma & Surgical Critical Care Associate Director of Trauma UHS of Eastern Carolina
Objectives • Define & classify shock • Outline management principles • Discuss goals of fluid resuscitation • Understand the concepts of oxygen supply and demand in managing shock. • Describe the physiologic effects of vasopressors and inotropic agents
Goals • Review hemodynamic techniques in the ICU • Introduce the concept of the cardiac cycle • Review of the pulmonary artery catheter parameters • Utilize the presentation to analyze clinical cases and to feel comfortable with pa-c parameters.
Shock: “A momentary pause in the act of death.” -John Collins Warren, 1800s
Hypotension • In Adults: • systolic BP 90 mm Hg • mean arterial pressure 60 mm Hg • systolic BP > 40 mm Hg from the patient’s baseline pressure
Definition SHOCK: inadequate organ perfusion to meet the tissue’s oxygenation demand.
“Hypoperfusion can be present in the absence of significant hypotension.” -fccs course
Pathophysiology ATP + H2O ADP + Pi + H+ + Energy Acidosis results from the accumulation of acid when during anaerobic metabolism the creation of ATP from ADP is slowed. H+ shift extracellularly and a metabolic acidosis develops
Pathophysiology • ATP production fails, the Na+/K+ pump fails resulting in the inability to correct the cell electronic potential. • Cell swelling occurs leading to rupture and death. • Oxidative Phosphorylation stops & anaerobic metabolism begins leading to lactic acid production.
Why Monitor? • Essential to understanding their disease • Describe the patient’s physiologic status • Facilitates diagnosis and treatment of shock
History • 1960’s • low BP = shock; MSOF resulted after BP restored • 1970’s • Swan & Ganz - flow-directed catheter • thermistor cardiac output • 1980’s • resuscitation based on oxygen delivery, consumption & oxygen transport balance.
Pulmonary Artery Catheter • INDICATIONS • volume status • cardiac status • COMPLICATIONS • technical • anatomic • physiologic
West’s Lung Zones • Zone I - PA > Pa > Pv • Zone II - Pa > PA > Pv • Zone III - Pa > Pv > PA • PA = alveolar • Pa = pulmonary artery • Pv = pulmonary vein
Measured Blood pressure Pulmonary A. pressure Heart rate Cardiac Output Stroke volume Wedge pressure CVP Calculated Mean BP Mean PAP Cardiac Index Stroke volume index SVRI LVSWI BSA Standard Parameters
Why Index? • Body habitus and size is individual • Inter-patient variability does not allow “normal” ranges • “Indexing” to patient with BSA allows for reproducible standard
PATIENT A 60 yo male 50 kg CO = 4.0 L/min BSA = 1.86 CI = 2.4 L/min/m2 PATIENT B 60 yo male 150 kg CO = 4.0 L/min BSA = 2.64 CI = 1.5 L/min/m2 Index Example
PA Insertion 20 15 10 5 PA 19/10 PAOP = 9 RA = 5 RV = 22/4 0
CVP • CVP of SVC at level of right atrium • pre-load “assessment” • normal 4 - 10 mm Hg • limited value
PAOP • End expiration • Reflection changes with positive pressure • Waveforms change every 20 cm
Waveform Analysis • A wave - atrial systole • C wave - tricuspid valve closure @ ventricular systole • V wave - venous filling of right atrium
Cardiac Cycle PVRI MPAP pulmonary PCWP Right ventricle Left ventricle RVSWI LVSWI MAP CVP systemic SVRI
Hemodynamic Calculations ParameterNormal Cardiac Index (CI) 2.8 - 4.2 Stroke Volume Index (SVI) 30 - 65 Sys Vasc Resistance Index (SVRI) 1600 - 2400 Left Vent Stroke Work Index (LVSWI) 43 - 62
Cardiac Index C.I. = HR x SVI SVI measures the amount of blood ejected by the ventricle with each cardiac contraction. Total blood flow = beats per minute x blood volume ejected per beat
SYSTEMIC (SVRI) MAP - CVP CI SVR = vasoconstriction SVR = vasodilation PULMONARY (PVRI) MPAP - PAOP CI PVR = constriction PE, hypoxia Vascular Resistance Index x 80 x 80 Vascular resistance = change in pressure/blood flow
Stroke Work LVSWI = (MAP-PAOP) x SVI x 0.0136 normal = 43 - 62 VSWI describe how well the ventricles are contracting and can be used to identify patients who have poor cardiac function. ventricular stroke work = pressure x vol. ejected
Definitions • O2 Delivery - volume of gaseous O2 delivered to the LV/min. • O2 Consumption - volume of gaseous O2 which is actually used by the tissue/min. • O2 Demand - volume of O2 actually needed by the tissues to function in an aerobic manner Demand > consumption = anaerobic metabolism
Rationale for Improving O2 Delivery Insult Tissue Hypoxia Demands are met Increased Delivery Increased Consumption
Critical O2 Delivery VO2I The critical value is variable & is dependent upon the patient, disease, and the metabolic demands of the patient. DO2I
Arterial Oxygen Content (CaO2) Venous Oxygen Content (CvO2) Arteriovenous Oxygen Difference (avDO2) Delivery (O2AVI) Consumption (VO2I) Efficiency of the oxygenation of blood and the rates of oxygen delivery and consumption Oxygen Calculations
Arterial Oxygen Content CaO2 = (1.34 x Hgb x SaO2) + (PaO2 x 0.0031) If low, check hemoglobin or pulmonary gas exchange
Arteriovenous Oxygen Difference avDO2 = CaO2 - CvO2 Values > 5.6 suggests more complete tissue oxygen extraction, typically seen in shock
Oxygen Delivery (DO2I) O2AVI = CI x CaO2 x 10 Normal values suggests that the heart & lungs are working efficiently to provide oxygen to the tissues. < 400 is bad sign
Oxygen Consumption VO2I = CI x (CaO2 - CvO2) If VO2I < 100 suggest tissues are not getting enough oxygen
SvO2 VO2 SvO2 = 1- DO2
Resuscitation Goals • CI = 4.5 L/min/m2 • DO2I = 600 mL/min/m2 • VO2I = 170 mL/min/m2 NOT ALL PATIENTS CAN ACHIEVE THESE GOALS Critically ill patients who can respond to their disease states by spontaneously or artificially meeting these goals do show a better survival.
“Shock is a symptom of its cause.” -fccs course
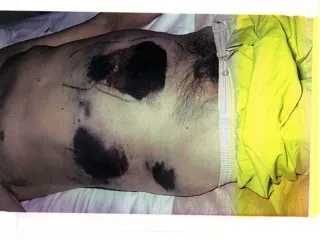
Signs of Organ Hypoperfusion • Mental Status Changes • Oliguria • Lactic Acidosis
Categories of Shock • HYPOVOLEMIC • CARDIOGENIC • DISTRIBUTIVE • OBSTRUCTIVE
Goals of Shock Resuscitation • Restore blood pressure • Normalize systemic perfusion • Preserve organ function
Causes hemorrhage vomiting diarrhea dehydration third-space loss burns Signs cardiac output PAOP SVR Hypovolemic Shock
Treatment - Hypovolemic • Reverse hypovolemia vs. hemorrhage control • Crystalloid vs. Colloid • PASG role? • Pressors?