Download
1 / 1
10 likes | 164 Vues
Written Discourse Comprehension in Aphasia: The Role of Executive Function Valarie B. Fleming & Swathi Kiran Department of Communication Sciences and Disorders, The University of Texas at Austin, TX. Abstract

E N D
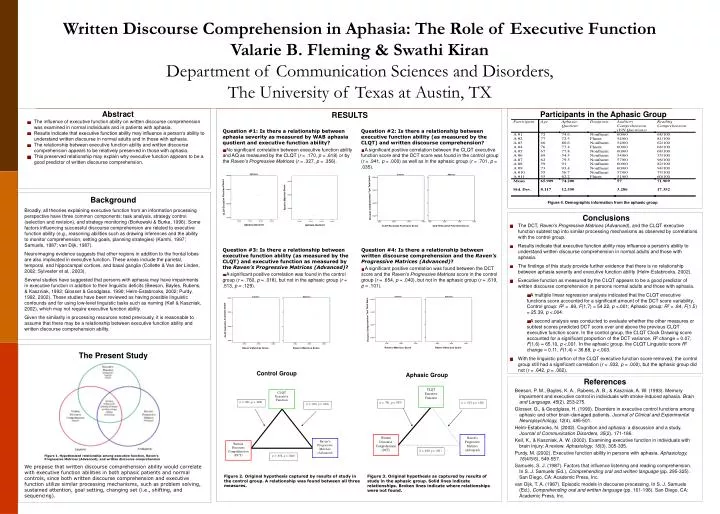
Written Discourse Comprehension in Aphasia: The Role of Executive FunctionValarie B. Fleming & Swathi KiranDepartment of Communication Sciences and Disorders,The University of Texas at Austin, TX Abstract • The influence of executive function ability on written discourse comprehension was examined in normal individuals and in patients with aphasia. • Results indicate that executive function ability may influence a person’s ability to understand written discourse in normal adults and in those with aphasia. • The relationship between executive function ability and written discourse comprehension appears to be relatively preserved in those with aphasia. • This preserved relationship may explain why executive function appears to be a good predictor of written discourse comprehension. Participants in the Aphasic Group RESULTS Question #1: Is there a relationship between aphasia severity as measured by WAB aphasia quotient and executive function ability? No significant correlation between executive function ability and AQ as measured by the CLQT (r = .170, p = .618) or by the Raven’s Progressive Matrices (r = .327, p = .356). Question #2: Is there a relationship between executive function ability (as measured by the CLQT) and written discourse comprehension? A significant positive correlation between the CLQTexecutive function score and the DCT score was found in the control group (r = .941, p = .000) as well as in the aphasic group (r = .701, p = .035). Background Broadly, all theories explaining executive function from an information processing perspective have three common components: task analysis, strategy control (selection and revision), and strategy monitoring (Borkowski & Burke, 1996). Some factors influencing successful discourse comprehension are related to executive function ability (e.g., reasoning abilities such as drawing inferences and the ability to monitor comprehension, setting goals, planning strategies) (Kamhi, 1997; Samuels, 1987; van Dijk, 1987). Neuroimaging evidence suggests that other regions in addition to the frontal lobes are also implicated in executive function. These areas include the parietal, temporal, and hippocampal cortices, and basal ganglia (Collette & Van der Linden, 2002; Sylvester et al., 2003). Several studies have suggested that persons with aphasia may have impairments in executive function in addition to their linguistic deficits (Beeson, Bayles, Rubens, & Kaszniak, 1993; Glosser & Goodglass, 1990; Helm-Estabrooks, 2002; Purdy, 1992, 2002). These studies have been reviewed as having possible linguistic confounds and for using low-level linguistic tasks such as naming (Keil & Kaszniak, 2002), which may not require executive function ability. Given the similarity in processing resources noted previously, it is reasonable to assume that there may be a relationship between executive function ability and written discourse comprehension ability. The Present Study We propose that written discourse comprehension ability would correlate with executive function abilities in both aphasic patients and normal controls, since both written discourse comprehension and executive function utilize similar processing mechanisms, such as problem solving, sustained attention, goal setting, changing set (i.e., shifting, and sequencing). Figure 4. Demographic information from the aphasic group Conclusions • The DCT, Raven’s Progressive Matrices (Advanced), and the CLQT executive function subtest tap into similar processing mechanisms as observed by correlations with the control group. • Results indicate that executive function ability may influence a person’s ability to understand written discourse comprehension in normal adults and those with aphasia. • The findings of this study provide further evidence that there is no relationship between aphasia severity and executive function ability (Helm-Estabrooks, 2002). • Executive function as measured by the CLQT appears to be a good predictor of written discourse comprehension in persons normal adults and those with aphasia. • A multiple linear regression analysis indicated that the CLQT executive functions score accounted for a significant amount of the DCT score variability, Control group: R2 = .89, F(1,7) = 54.22, p <.001; Aphasic group: R2 = .84, F(1,5) = 25.39, p <.004. • A second analysis was conducted to evaluate whether the other measures or subtest scores predicted DCT score over and above the previous CLQT executive function score. In the control group, the CLQT Clock Drawing score accounted for a significant proportion of the DCT variance, R2 change = 0.07, F(1,6) = 65.10, p <.001. In the aphasic group, the CLQT Linguistic score R2change = 0.11, F(1,4) = 36.88, p <.003. • With the linguistic portion of the CLQT executive function score removed, the control group still had a significant correlation (r = .932, p = .000), but the aphasic group did not (r = .642, p = .062). Question #3: Is there a relationship between executive function ability (as measured by the CLQT) and executive function as measured by the Raven’s Progressive Matrices (Advanced)? A significant positive correlation was found in the control group (r = .760, p = .018), but not in the aphasic group (r = .513, p = .129). Question #4: Is there a relationship between written discourse comprehension and the Raven’s Progressive Matrices (Advanced)? A significant positive correlation was found between the DCT score and the Raven’s Progressive Matrices score in the control group (r = .654, p = .040), but not in the aphasic group (r = .619, p = .101). Control Group Aphasic Group References Beeson, P. M., Bayles, K. A., Rubens, A. B., & Kaszniak, A. W. (1993). Memory impairment and executive control in individuals with stroke-induced aphasia. Brain and Language, 45(2), 253-275. Glosser, G., & Goodglass, H. (1990). Disorders in executive control functions among aphasic and other brain-damaged patients. Journal of Clinical and Experimental Neuropsychology, 12(4), 485-501. Helm-Estabrooks, N. (2002). Cognition and aphasia: a discussion and a study. Journal of Communication Disorders, 35(2), 171-186. Keil, K., & Kaszniak, A. W. (2002). Examining executive function in individuals with brain injury: A review. Aphasiology, 16(3), 305-335. Purdy, M. (2002). Executive function ability in persons with aphasia. Aphasiology, 16(4/5/6), 549-557. Samuels, S. J. (1987). Factors that influence listening and reading comprehension. In S. J. Samuels (Ed.), Comprehending oral and written language (pp. 295-325). San Diego, CA: Academic Press, Inc. van Dijk, T. A. (1987). Episodic models in discourse processing. In S. J. Samuels (Ed.), Comprehending oral and written language (pp. 161-196). San Diego, CA: Academic Press, Inc. Figure 1. Hypothesized relationship among executive function, Raven's Progressive Matrices (Advanced), and written discourse comprehension Figure 2. Original hypothesis captured by results of study in the control group. A relationship was found between all three measures. Figure 3. Original hypothesis as captured by results of study in the aphasic group. Solid lines indicate relationships. Broken lines indicate where relationships were not found.