Download
1 / 1
10 likes | 439 Vues
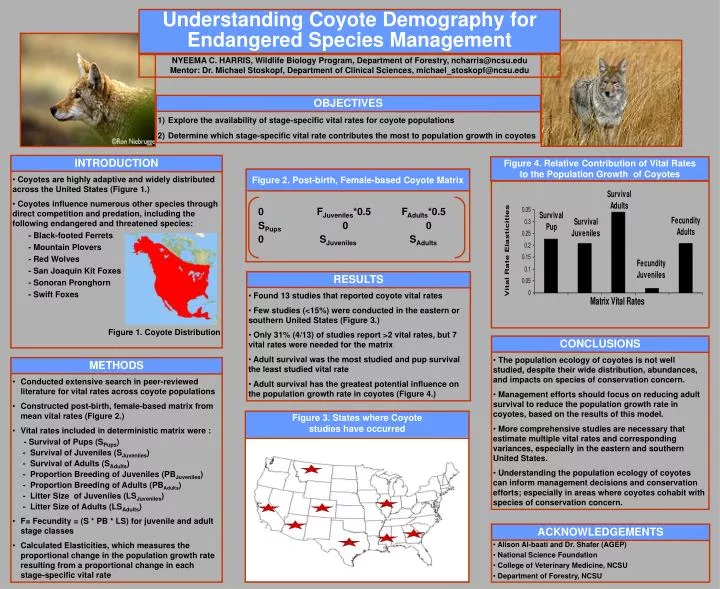
Understanding Coyote Demography for Endangered Species Management. NYEEMA C. HARRIS, Wildlife Biology Program, Department of Forestry, ncharris@ncsu.edu Mentor: Dr. Michael Stoskopf, Department of Clinical Sciences, michael_stoskopf@ncsu.edu. INTRODUCTION

E N D
Understanding Coyote Demography for Endangered Species Management NYEEMA C. HARRIS, Wildlife Biology Program, Department of Forestry, ncharris@ncsu.edu Mentor: Dr. Michael Stoskopf, Department of Clinical Sciences, michael_stoskopf@ncsu.edu • INTRODUCTION • Coyotes are highly adaptive and widely distributed across the United States (Figure 1.) • Coyotes influence numerous other species through direct competition and predation, including the following endangered and threatened species: • - Black-footed Ferrets • - Mountain Plovers • - Red Wolves • - San Joaquin Kit Foxes • - Sonoran Pronghorn • - Swift Foxes • Figure 1. Coyote Distribution • OBJECTIVES • Explore the availability of stage-specific vital rates for coyote populations • Determine which stage-specific vital rate contributes the most to population growth in coyotes • CONCLUSIONS • The population ecology of coyotes is not well studied, despite their wide distribution, abundances, and impacts on species of conservation concern. • Management efforts should focus on reducing adult survival to reduce the population growth rate in coyotes, based on the results of this model. • More comprehensive studies are necessary that estimate multiple vital rates and corresponding variances, especially in the eastern and southern United States. • Understanding the population ecology of coyotes can inform management decisions and conservation efforts; especially in areas where coyotes cohabit with species of conservation concern. • ACKNOWLEDGEMENTS • Alison Al-baati and Dr. Shafer (AGEP) • National Science Foundation • College of Veterinary Medicine, NCSU • Department of Forestry, NCSU • METHODS • Conducted extensive search in peer-reviewed literature for vital rates across coyote populations • Constructed post-birth, female-based matrix from mean vital rates (Figure 2.) • Vital rates included in deterministic matrix were : • - Survival of Pups (SPups) • - Survival of Juveniles (SJuveniles) • - Survival of Adults (SAdults) • - Proportion Breeding of Juveniles (PBJuveniles) • - Proportion Breeding of Adults (PBAdults) • - Litter Size of Juveniles (LSJuveniles) • - Litter Size of Adults (LSAdults) • F= Fecundity = (S * PB * LS) for juvenile and adult stage classes • Calculated Elasticities, which measures the proportional change in the population growth rate resulting from a proportional change in each stage-specific vital rate • RESULTS • Found 13 studies that reported coyote vital rates • Few studies (<15%) were conducted in the eastern or southern United States (Figure 3.) • Only 31% (4/13) of studies report >2 vital rates, but 7 vital rates were needed for the matrix • Adult survival was the most studied and pup survival the least studied vital rate • Adult survival has the greatest potential influence on the population growth rate in coyotes (Figure 4.) Figure 2. Post-birth, Female-based Coyote Matrix Figure 4. Relative Contribution of Vital Rates to the Population Growth of Coyotes Figure 3. States where Coyote studies have occurred 0 FJuveniles*0.5 FAdults*0.5 SPups 0 0 0 SJuveniles SAdults