Download
1 / 94
960 likes | 1.51k Vues
Solaris/Linux Performance Measurement and Tuning. Adrian Cockcroft, acockcroft@netflix.com June 9, 2014. Abstract.

E N D
Solaris/Linux Performance Measurement and Tuning Adrian Cockcroft, acockcroft@netflix.com June 9, 2014
Abstract • This course focuses on the measurement sources and tuning parameters available in Unix and Linux, including TCP/IP measurement and tuning, complex storage subsystems, and with a deep dive on advanced Solaris metrics such as microstates and extended system accounting. • The meaning and behavior of metrics is covered in detail. Common fallacies, misleading indicators, sources of measurement error and other traps for the unwary will be exposed. • Free tools for Capacity Planning are covered in detail by this presenter in a separate Usenix Workshop. Solaris/Linux Performance Measurement and Tuning
Sources • Adrian Cockcroft • Sun Microsystems 1988-2004, Distinguished Engineer • eBay Research Labs 2004-2007, Distinguished Engineer • Netflix 2007, Director - Web Engineering • Note: I am a Netflix employee, but this material does not refer to and is not endorsed by Netflix. It is based on the author's work over the last 20 years. • CMG Papers and Sunday Workshops by the author - see www.cmg.org • Unix CPU Time Measurement Errors - (Best paper 1998) • TCP/IP Tutorial - Sunday Workshop • Capacity Planning - Sunday Workshop • Grid Tutorial - Sunday Workshop • Capacity Planning with Free Tools - Sunday Workshop • Books by the author • Sun Performance and Tuning, Prentice Hall, 1994, 1998 (2nd Ed) • Resource Management, Prentice Hall, 2000 • Capacity Planning for Internet Services, Prentice Hall, 2001 Solaris/Linux Performance Measurement and Tuning
Contents • Capacity Planning Definitions • Metric collection interfaces • Process - microstate and extended accounting • CPU - measurement issues • Network - Internet Servers and TCP/IP • Disks - iostat, simple disks and RAID • Memory • Quick tips and Recipes • References Solaris/Linux Performance Measurement and Tuning
Definitions Solaris/Linux Performance Measurement and Tuning
Capacity Planning Definitions • Capacity • Resource utilization and headroom • Planning • Predicting future needs by analyzing historical data and modeling future scenarios • Performance Monitoring • Collecting and reporting on performance data • Unix/Linux (apologies to users of OSX, HP-UX, AIX etc.) • Emphasis on Solaris since it is a comprehensively instrumented and full featured Unix • Linux is mostly a subset Solaris/Linux Performance Measurement and Tuning
Measurement Terms and Definitions • Bandwidth - gross work per unit time [unattainable] • Throughput - net work per unit time • Peak throughput - at maximum acceptable response time • Response time - time to complete a unit of work including waiting • Service time - time to process a unit of work after waiting • Queue length - number of requests waiting • Utilization - busy time relative to elapsed time [can be misleading] • Rule of thumb: Estimate 95th percentile response time as three times mean response time Solaris/Linux Performance Measurement and Tuning
Capacity Planning Requirements • We care about CPU, Memory, Network and Disk resources, and Application response times • We need to know how much of each resource we are using now, and will use in the future • We need to know how much headroom we have to handle higher loads • We want to understand how headroom varies, and how it relates to application response times and throughput • We want to be able to find the bottleneck in an under-performing system Solaris/Linux Performance Measurement and Tuning
Metrics Solaris/Linux Performance Measurement and Tuning
Measurement Data Interfaces • Several generic raw access methods • Read the kernel directly • Structured system data • Process data • Network data • Accounting data • Application data • Command based data interfaces • Scrape data from vmstat, iostat, netstat, sar, ps • Higher overhead, lower resolution, missing metrics • Data available is platform and release specific either way Solaris/Linux Performance Measurement and Tuning
Reading kernel memory - kvm • The only way to get data in very old Unix variants • Use kernel namelist symbol table and open /dev/kmem • Solaris wraps up interface in kvm library • Advantages • Still the only way to get at some kinds of data • Low overhead, fast bulk data capture • Disadvantages • Too much intimate implementation detail exposed • No locking protection to ensure consistent data • Highly non-portable, unstable over releases and patches • Tools break when kernel moves between 32 and 64bit address support Solaris/Linux Performance Measurement and Tuning
Structured Kernel Statistics - kstat • Solaris 2 introduced kstat and extended usage in each release • Used by Solaris 2 vmstat, iostat, sar, network interface stats, etc. • Advantages • The recommended and supported Solaris metric access API • Does not require setuid root commands to access for reads • Individual named metrics stable over releases • Consistent data using locking, but low overhead • Unchanged when kernel moves to 64bit address support • Extensible to add metrics without breaking existing code • Disadvantages • Somewhat complex hierarchical kstat_chain structure • State changes (device online/offline) cause kstat_chain rebuild Solaris/Linux Performance Measurement and Tuning
Kernel Trace - TNF, Dtrace, ktrace • Solaris, Linux, Windows and other Unixes have similar features • Solaris has TNF probes and prex command to control them • User level probe library for hires tracepoints allows instrumentation of multithreaded applications • Kernel level probes allow disk I/O and scheduler tracing • Advantages • Low overhead, microsecond resolution • I/O trace capability is extremely useful • Disadvantages • Too much data to process with simple tracing capabilities • Trace buffer can overflow or cause locking issues • Solaris 10 Dtrace is a quite different beast! Much more flexible Solaris/Linux Performance Measurement and Tuning
Dtrace – Dynamic Tracing • One of the most exiting new features in Solaris 10, rave reviews • Book: "Solaris Performance and Tools" by Richard McDougall and Brendan Gregg • Advantages • No overhead when it is not in use • Low overhead probes can be put anywhere/everywhere • Trace data is correlated and filtered at source, get exactly the data you want, very sophisticated data providers included • Bundled, supported, designed to be safe for production systems • Disadvantages • Solaris specific, but being ported to BSD/Linux • No high level tools support yet • Yet another scripting language to learn – somewhat similar to “awk” Solaris/Linux Performance Measurement and Tuning
Hardware counters • Solaris cpustat for X86 and UltraSPARC pipeline and cache counters • Solaris busstat for server backplanes and I/O buses, corestat for multi-core systems • Intel Trace Collector, Vampir for Linux • Most modern CPUs and systems have counters • Advantages • See what is really happening, more accurate than kernel stats • Cache usage useful for tuning code algorithms • Pipeline usage useful for HPC tuning for megaflops • Backplane and memory bank usage useful for database servers • Disadvantages • Raw data is confusing, lots of architectural background info needed • Most tools focus on developer code tuning Solaris/Linux Performance Measurement and Tuning
Configuration information • Configuration data comes from too many sources! • Solaris device tree displayed by prtconf and prtdiag • Solaris 8 adds dynamic configuration notification device picld • SunVTS component test system has vtsprobe to get config • SCSI device info using iostat -E in Solaris • Logical volume info from product specific vxprint and metastat • Hardware RAID info from product specific tools • Critical storage config info must be accessed over ethernet… • It is very hard to combine all this data! • DMTF CIM objects try to address this, but no-one seems to use them… • Free tool - Config Engine: http://www.cfengine.org Solaris/Linux Performance Measurement and Tuning
Application instrumentation Examples • Oracle V$ Tables – detailed metrics used by many tools • ARM standard instrumentation • Custom do-it-yourself and log file scraping • Advantages • Focussed application specific information • Business metrics needed to do real capacity planning • Disadvantages • No common access methods • ARM is a collection interface only, vendor specific tools, data • Very few applications are instrumented, even fewer have support from performance tools vendors Solaris/Linux Performance Measurement and Tuning
Kernel values, tunables and defaults • There is often far too much emphasis on kernel tweaks • There really are few “magic bullet” tunables • It rarely makes a significant difference • Fix the system configuration or tune the application instead! • Very few adjustable components • “No user serviceable parts inside” • But Unix has so much history people think it is like a 70’s car • Solaris really is dynamic, adaptive and self-tuning • Most other “traditional Unix” tunables are just advisory limits • Tweaks may be workarounds for bugs/problems • Patch or OS release removes the problem - remove the tweak Solaris Tunable Parameters Reference Manual (if you must…) • http://docs.sun.com/app/docs/doc/817-0404 Solaris/Linux Performance Measurement and Tuning
Processes Solaris/Linux Performance Measurement and Tuning
Process based data - /proc • Used by ps, proctool and debuggers, pea.se, proc(1) tools on Solaris • Solaris and Linux both have /proc/pid/metric hierarchy • Linux also includes system information in /proc rather than kstat • Advantages • The recommended and supported process access API • Metric data structures reasonably stable over releases • Consistent data using locking • Solaris microstate data provides accurate process state timers • Disadvantages • High overhead for open/read/close for every process • Linux reports data as ascii text, Solaris as binary structures Solaris/Linux Performance Measurement and Tuning
Tracing and profiling • Tracing Tools • truss - shows system calls made by a process • sotruss / apitrace - shows shared library calls • prex - controls TNF tracing for user and kernel code • Profiling Tools • Compiler profile feedback using -xprofile=collect and use • Sampled profile relink using -p and prof/gprof • Function call tree profile recompile using -pg and gprof • Shared library call profiling setenv LD_PROFILE and gprof • Accurate CPU timing for process using /usr/proc/bin/ptime • Microstate process information using pea.se and pw.se 10:40:16 name lwmx pid ppid uid usr% sys% wait% chld% size rss pf nis_cachemgr 5 176 1 0 1.40 0.19 0.00 0.00 16320 11584 0.0 jre 1 17255 3184 5743 11.80 0.19 0.00 0.00 178112 110336 0.0 sendmail 1 16751 1 0 1.01 0.43 0.00 0.43 18624 16384 0.0 se.sparc.5.6 1 16741 1186 9506 5.90 0.47 0.00 0.00 16320 14976 0.0 imapd 1 16366 198 5710 6.88 1.09 1.02 0.00 34048 29888 0.1 dtmail 10 16364 9070 5710 0.75 1.12 0.00 0.00 102144 94400 0.0 Solaris/Linux Performance Measurement and Tuning
Accounting Records • Standard Unix System V Accounting - acct • Tiny, incomplete (no process id!) low resolution, no overhead! • Solaris Extended System and Network Accounting - exacct • Flexible, Overly complex, Detailed data • Interval support for recording long running processes • No overhead! 100% capture ratio for infrequent samples! Solaris/Linux Performance Measurement and Tuning
Extracct for Solaris • extracct tool to get extended acct data out in a useful form • See http://perfcap.blogspot.com for description and get code from http://www.orcaware.com/orca/pub/extracct • Pre-compiled code for Solaris SPARC and x86. Solaris 8 to 10. • Useful data is logged in regular columns for easy import • Includes low overhead network accounting config file for TCP flows • Interval accounting option to force all processes to cut records • Automatic log filename generation and clean switching • Designed to run directly as a cron job, useful today • More work needed to interface output to SE toolkit and Orca Solaris/Linux Performance Measurement and Tuning
Example Extracct Output # ./extracctUsage: extracct [-vwr] [ file | -a dir ] -v: verbose-w: wracct all processes first-r: rotate logs-a dir: use acctadm.conf to get input logs, and write output files to dir The usual way to run the command will be from cron as shown 0 * * * * /opt/exdump/extracct -war /var/tmp/exacct > /dev/null 2>&12 * * * * /bin/find /var/adm/exacct -ctime +7 -exec rm {} \; This also shows how to clean up old log files, I only delete the binary files in this example, and I created /var/tmp/exacct to hold the text files. The process data in the text file looks like this:timestamp locltime duration procid ppid uid usr sys majf rwKB vcxK icxK sigK sycK arMB mrMB command1114734370 17:26:10 0.0027 16527 16526 0 0.000 0.002 0 0.53 0.00 0.00 0.00 0.1 0.7 28.9 acctadm1114734370 17:26:10 0.0045 16526 16525 0 0.000 0.001 0 0.00 0.00 0.00 0.00 0.1 1.1 28.9 sh1114734370 17:26:10 0.0114 16525 8020 0 0.001 0.005 0 1.71 0.00 0.00 0.00 0.3 1.0 28.9 exdump1109786959 10:09:19 -1.0000 1 0 0 4.311 3.066 96 47504.69 49.85 0.18 0.34 456.2 0.9 1.0 init1109786959 10:09:19 -1.0000 2 0 0 0.000 0.000 0 0.00 0.00 0.00 0.00 0.0 0.0 0.0 pageout Solaris/Linux Performance Measurement and Tuning
What would you say if you were asked: How busy is that system? A: I have no idea… A: 10% A: Why do you want to know? A: I’m sorry, you don’t understand your question…. Solaris/Linux Performance Measurement and Tuning
Headroom Estimation • CPU Capacity • Relatively easy to figure out • Network Usage • Use bytes not packets/s • Memory Capacity • Tricky - easier in Solaris 8 • Disk Capacity • Can be very complex Solaris/Linux Performance Measurement and Tuning
Utilization Headroom Margin Headroom • Headroom is available usable resources • Total Capacity minus Peak Utilization and Margin • Applies to CPU, RAM, Net, Disk and OS Solaris/Linux Performance Measurement and Tuning
Utilization Utilization • Utilization is the proportion of busy time • Always defined over a time interval Solaris/Linux Performance Measurement and Tuning
Response Time • Response Time = Queue time + Service time • The Usual Assumptions… • Steady state averages • Random arrivals • Constant service time • M servers processing the same queue • Approximations • Queue length = Throughput x Response Time • (Little's Law) • Response Time = Service Time / (1 - UtilizationM) Solaris/Linux Performance Measurement and Tuning
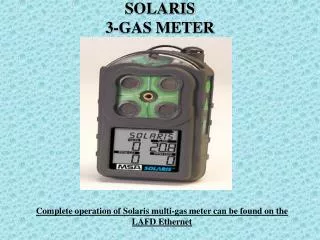
Headroom margin Response Time Curves The traditional view of Utilization as a proxy for response time Systems with many CPUs can run at higher utilization levels, but degrade more rapidly when they run out of capacity Headroom margin should be set according to a response time target. R = S / (1 - (U%)m) Solaris/Linux Performance Measurement and Tuning
So what's the problem with Utilization? • Unsafe assumptions! Complex adaptive systems are not simple! • Random arrivals? • Bursty traffic with long tail arrival rate distribution • Constant service time? • Variable clock rate CPUs, inverse load dependent service time • Complex transactions, request and response dependent • M servers processing the same queue? • Virtual servers with varying non-integral concurrency • Non-identical servers or CPUs, Hyperthreading, Multicore, NUMA • Measurement Errors? • Mechanisms with built in bias, e.g. sampling from the scheduler clock • Platform and release specific systemic changes in accounting of interrupt time Solaris/Linux Performance Measurement and Tuning
Threaded CPU Pipelines • CPU microarchitecture optimizations • Extra register sets working with one execution pipeline • When the CPU stalls on a memory read, it switches registers/threads • Operating system sees multiple schedulable entities (CPUs) • Intel Hyperthreading • Each CPU core has an extra thread to use spare cycles • Typical benefit is 20%, so total capacity is 1.2 CPUs • I.e. Second thread much slower when first thread is busy • Hyperthreading aware optimizations in recent operating systems • Sun “CoolThreads” • "Niagara" SPARC CPU has eight cores, one shared floating point unit • Each CPU core has four threads, but each core is a very simple design • Behaves like 32 slow CPUs for integer, snail like uniprocessor for FP • Overall throughput is very high, performance per watt is exceptional • New Niagara 2 has dedicated FPU and 8 threads per core (total 64 threads) Solaris/Linux Performance Measurement and Tuning
Variable Clock Rate CPUs • Laptop and other low power devices do this all the time • Watch CPU usage of a video application and toggle mains/battery power…. • Server CPU Power Optimization - AMD PowerNow!™ • AMD Opteron server CPU detects overall utilization and reduces clock rate • Actual speeds vary, but for example could reduce from 2.6GHz to 1.2GHz • Changes are not understood or reported by operating system metrics • Speed changes can occur every few milliseconds (thermal shock issues) • Dual core speed varies per socket, Quad core varies per core • Quad core can dynamically stop entire cores to save power • Possible scenario: • You estimate 20% utilization at 2.6GHz • You see 45% reported in practice (at 1.2GHz) • Load doubles, reported utilization drops to 40% (at 2.6GHz) • Actual mapping of utilization to clock rate is unknown at this point • Note: Older and "low power" Opterons used in blades fix clock rate Solaris/Linux Performance Measurement and Tuning
Virtual Machine Monitors • VMware, Xen, IBM LPARs etc. • Non-integral and non-constant fractions of a machine • Naiive operating systems and applications that don't expect this behavior • However, lots of recent tools development from vendors • Average CPU count must be reported for each measurement interval • VMM overhead varies, application scaling characteristics may be affected Solaris/Linux Performance Measurement and Tuning
Measurement Errors • Mechanisms with built in bias • e.g. sampling from the scheduler clock underestimates CPU usage • Solaris 9 and before, Linux, AIX, HP-UX “sampled CPU time” • Solaris 10 and HP-UX “measured CPU time” far more accurate • Solaris microstate process accounting always accurate but in Solaris 10 microstates are also used to generate system-wide CPU • Accounting of interrupt time • Platform and release specific systemic changes • Solaris 8 - sampled interrupt time spread over usr/sys/idle • Solaris 9 - sampled interrupt time accumulated into sys only • Solaris 10 - accurate interrupt time spread over usr/sys/idle • Solaris 10 Update 1 - accurate interrupt time in sys only Solaris/Linux Performance Measurement and Tuning
Storage Utilization • Storage virtualization broke utilization metrics a long time ago • Host server measures busy time on a "disk" • Simple disk, "single server" response time gets high near 100% utilization • Cached RAID LUN, one I/O stream can report 100% utilization, but full capacity supports many threads of I/O since there are many disks and RAM buffering • New metric - "Capability Utilization" • Adjusted to report proportion of actual capacity for current workload mix • Measured by tools such as Ortera Atlas (http://www.ortera.com) Solaris/Linux Performance Measurement and Tuning
How to plot Headroom • Measure and report absolute CPU power if you can get it… • Plot shows headroom in blue, margin in red, total power tracking day/night workload variation, plotted as mean + two standard deviations. Solaris/Linux Performance Measurement and Tuning
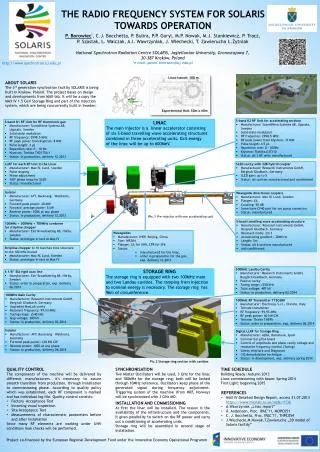
“Cockcroft Headroom Plot” • Scatter plot of response time (ms) vs. Throughput (KB) from iostat metrics • Histograms on axes • Throughput time series plot • Shows distributions and shape of response time • Fits throughput weighted inverse gaussian curve • Coded using "R" statistics package • Blogged development at http://perfcap.blogspot.com/search?q=chp Solaris/Linux Performance Measurement and Tuning
Response Time vs. Throughput • A different problem… • Thread-limited appserver • CPU utilization is low • Measurements are of a single SOA service pool • Response is in milliseconds • Throughput is executions/s Exec Resp Min. : 1.00 Min. : 0.0 1st Qu.: 2.00 1st Qu.: 150.0 Median : 8.00 Median : 361.0 Mean : 64.68 Mean : 533.5 3rd Qu.: 45.00 3rd Qu.: 771.9 Max. :10795.00 Max. :19205.0 Solaris/Linux Performance Measurement and Tuning
How busy is that system again? • Check your assumptions… • Record and plot absolute capacity for each measurement interval • Plot response time as a function of throughput, not just utilization • SOA response characteristics are complicated… • More detailed discussion in CMG06 Paper and blog entries • “Utilization is Virtually Useless as a Metric” - Adrian Cockcroft - CMG06 http://perfcap.blogspot.com/search?q=utilization http://perfcap.blogspot.com/search?q=chp Solaris/Linux Performance Measurement and Tuning
CPU Solaris/Linux Performance Measurement and Tuning
CPU Capacity Measurements • CPU Capacity is defined by CPU type and clock rate, or a benchmark rating like SPECrateInt2000 • CPU throughput - CPU scheduler transaction rate • measured as the number of voluntary context switches • CPU Queue length • CPU load average gives an approximation via a time decayed average of number of jobs running and ready to run • CPU response time • Solaris microstate accounting measures scheduling delay • CPU utilization • Defined as busy time divided by elapsed time for each CPU • Badly distorted and undermined by virtualization…… Solaris/Linux Performance Measurement and Tuning
CPU time measurements • Biased sample CPU measurements • See 1998 Paper "Unix CPU Time Measurement Errors" • Microstate measurements are accurate, but are platform and tool specific. Sampled metrics are more inaccurate at low utilization • CPU time is sampled by the 100Hz clock interrupt • sampling theory says this is accurate for an unbiased sample • the sample is very biased, as the clock also schedules the CPU • daemons that wakeup on the clock timer can hide in the gaps • problem gets worse as the CPU gets faster • Increase clock interrupt rate? (Solaris) • set hires_tick=1 sets rate to 1000Hz, good for realtime wakeups • harder to hide CPU usage, but slightly higher overhead • Use measured CPU time at per-process level • microstate accounting takes timestamp on each state change • very accurate and also provides extra information • still doesn’t allow for interrupt overhead • Prstat -m and the pea.se command uses this accurate measurement Solaris/Linux Performance Measurement and Tuning
More CPU Measurement Issues • Platform and release specific details • Are interrupts included in system time? It depends… • Is vmstat CPU sampled (Linux) or measured (Solaris 10)? • Load average includes CPU queue (Solaris) or CPU+Disk (Linux) • Wait for I/O is a misleading subset of idle time, metric removed in Solaris 10, ignore it in all other Unix/Linux releases Solaris/Linux Performance Measurement and Tuning
Controlling and CPUs in Solaris • psrinfo - show CPU status and clock rate • Corestat - show internal behavior of multi-core CPUs • psradm - enable/disable CPUs • pbind - bind a process to a CPU • psrset - create sets of CPUs to partition a system • At least one CPU must remain in the default set, to run kernel services like NFS threads • All CPUs still take interrupts from their assigned sources • Processes can be bound to sets • mpstat shows per-CPU counters (per set in Solaris 9) CPU minf mjf xcal intr ithr csw icsw migr smtx srw syscl usr sys wt idl 0 45 1 0 232 0 780 234 106 201 0 950 72 28 0 0 1 29 1 0 243 0 810 243 115 186 0 1045 69 31 0 0 2 27 1 0 235 0 827 243 110 199 0 1000 75 25 0 0 3 26 0 0 217 0 794 227 120 189 0 925 70 30 0 0 4 9 0 0 234 92 403 94 84 1157 0 625 66 34 0 0 Solaris/Linux Performance Measurement and Tuning
Monitoring CPU mutex lock statistics • To fix mutex contention change the application workload or upgrade to a newer OS release • Locking strategies are too complex to be patched • Lockstat Command • very powerful and easy to use • Solaris 8 extends lockstat to include kernel CPU time profiling • dynamically changes all locks to be instrumented • displays lots of useful data about which locks are contending # lockstat sleep 5 Adaptive mutex spin: 3318 events Count indv cuml rcnt spin Lock Caller ------------------------------------------------------------------------------- 601 18% 18% 1.00 1 flock_lock cleanlocks+0x10 302 9% 27% 1.00 7 0xf597aab0 dev_get_dev_info+0x4c 251 8% 35% 1.00 1 0xf597aab0 mod_rele_dev_by_major+0x2c 245 7% 42% 1.00 3 0xf597aab0 cdev_size+0x74 160 5% 47% 1.00 7 0xf5b3c738 ddi_prop_search_common+0x50 Solaris/Linux Performance Measurement and Tuning
Network Solaris/Linux Performance Measurement and Tuning
Network protocol data • Based on a streams module interface in Solaris • Solaris 2 ndd interface used to configure protocols and interfaces • Solaris 2 mib interface used by netstat -s and snmpd to get TCP stats etc. • Advantages • Individual named metrics reasonably stable over releases • Consistent data using locking • Extensible to add metrics without breaking existing code • Solaris ndd can retune TCP online without reboot • System data is often also made available via SNMP prototcol • Disadvantages • Underlying API is not supported, SNMP access is preferred Solaris/Linux Performance Measurement and Tuning
Network interface and NFS metrics • Network interface throughput counters from kstat • rbytes, obytes — read and output byte counts • multircv, multixmt — multicast byte counts • brdcstrcv, brdcstxmt — broadcast byte counts • norcvbuf, noxmtbuf — buffer allocation failure counts • NFS Client Statistics Shown in iostat on Solaris crun% iostat -xnP extended device Statistics r/s w/s kr/s kw/s wait actv wsvc_t asvc_t %w %b device 0.0 0.0 0.0 0.0 0.0 0.0 0.0 0.0 0 0 crun:vold(pid363) 0.0 0.0 0.0 0.0 0.0 0.0 0.0 0.0 0 0 servdist:/usr/dist 0.0 0.5 0.0 7.9 0.0 0.0 0.0 20.7 0 1 servhome:/export/home/adrianc 0.0 0.0 0.0 0.0 0.0 0.0 0.0 0.0 0 0 servhome:/var/mail 0.0 1.3 0.0 10.4 0.0 0.2 0.0 128.0 0 2 c0t2d0s0 0.0 0.0 0.0 0.0 0.0 0.0 0.0 0.0 0 0 c0t2d0s2 Solaris/Linux Performance Measurement and Tuning
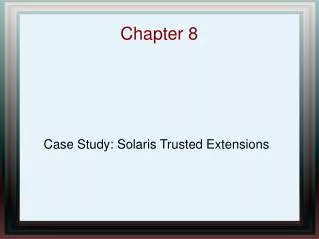
How NFS Works • Showing the many layers of caching involved Solaris/Linux Performance Measurement and Tuning