Download
1 / 13
140 likes | 381 Vues
Du Pont Analysis. Return On Equity. R eturn on equity reveals how much after-tax profit a company earned in comparison to the total amount of shareholder equity found on the balance sheet

E N D
Return On Equity Return on equity reveals how much after-tax profit a company earned in comparison to the total amount of shareholder equity found on the balance sheet Companies that boast a high return on equity with little or no debt relative to equity are able to grow without large capital expenditures, allowing the owners of the business to take freshly generated surplus cash and deploy it elsewhere. Two companies can have the same return on equity, yet one can be a much better business with much lower risks. EPS= ROE * Equity/ Outstanding Share The ROE is a better gauge than simple EPS of how a company is deploying its capital to build a profitable business. The higher the ROE, the more wealth the company is creating for its shareholders, and the better return they can expect from their investment. A company’s ROE should be compared to that of its competitors and other companies in the same sector, whereas EPS and P/E ratios are better used as a gauge of whether the shares themselves are over or undervalued.
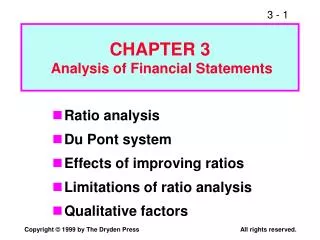
Du Pont Analysis Finance executive at E.I. du Pont de Nemours and Co., of Wilmington, Delaware, created the DuPont system of financial analysis in 1919. DuPont model ROE breakdown instantly gives insight into the capital structure of a firm, the quality of the business, and the levers that are driving the return on invested capital Dupont analysis allows you to know what specific variables are causing the return on equity in the first place
Components of Du Pont Analysis ROI= NetProfitMargin X Asset Turnover ROE= ROI X (TOTAL ASSET/ EQUITY)= ROI X EQUITY MULTIPLIER Three components in the calculation of return on equity when doing a DuPont model analysis. These are: I. The Net Profit Margin Ii. Asset Turnover Iii. The Equity Multiplier
Net Profit Margin 1. Net Profit Margin= Net Income ÷ Revenue (Operating Income) Net Profit Margin: After-tax profit a company generated for each rupee of revenue. Net Profit Margin varies according to industry. Helpful in comparing competitors Net Profit Margin acts as safety cushion. Company with large NPM can take more risk than company with low NPM despite same ROE Although the general rule-of-thumb is that a higher net profit margin is preferable, it is not uncommon for management to purposely lower the net profit margin in a bid to attract higher sales. Example Wall Mart
Asset TurnOver Ratio 2. Asset Turnover: It measure of how effectively a company converts its assets into sales. Asset Turnover = Revenue ÷ Assets Asset turnover ratio tends to be inversely related to the net profit margin. Investor can compare companies using different models (low-profit, high-volume vs. high-profit, low-volume) and determine which business is more attractive.
Wal-Mart's founder, the late Sam Walton, often wrote and spoke about the insight that allowed him to build one of the largest fortunes in human history through his family holding company, Walton Enterprises, LLC. He realized that he could make significantly more absolute profit by shoving enormous volumes of merchandise at relatively lower profit margins over his existing asset base than he could by extracting huge profit margins on fewer individual sales. Along with other tricks he used, such as leveraging sources of other people's money using vendor financing, this allowed him to take market share from competitors and grow exponentially. He was amazed that the people competing against him could see how rich he was getting but couldn't bring themselves to switch to the discount model because they had become addicted to the idea of high-profit margins, focusing on those ]\
Equity Multiplier Equity Multiplier = Assets ÷ Shareholders’ Equity The equity multiplier, which is a measure of financial leverage, It allows the investor to see what portion of the return on equity is the result of debt. It is possible for a company with terrible sales and margins to take on excessive debt and artificially increase its return on equity
Johnson and Johnson case Johnson & Johnson's complex history in the past, explaining that it is really a holding company that has ownership stakes in 265 controlled subsidiaries spread across three different focus areas: consumer healthcare, medical devices, and pharmaceuticals. Looking at its DuPont return on equity analysis, it is clear that it truly is one of the greatest businesses that has ever existed. What is remarkable is that management has arranged the firm's structure so that debt plays a major role in the returns while the absolute debt level is extremely low relative to cash flow. In fact, Johnson & Johnson's interest coverage ratio is so good, and its cash flows so secure, that following the 2008-2009 collapse that was the worst economic maelstrom since the Great Depression back in 1929-1933, it was one of only four companies with Triple A rated bonds. NOTE: EBIT (earnings before interest and taxes) ÷ Interest Expense = Interest Coverage Ratio Investor should not invest in company which has intrest cover ratio below 1.5. This indicates company has trouble paying interest
Johnson and Johnson Case Johnson's most recently completed full fiscal year, 2015. Pulling its Form 10-K filing, we find the necessary DuPont model return on equity components in the financial section statement: Revenue: $70,074,000,000 Net Income: $15,409,000,000 Assets: $133,411,000,000 Shareholders' Equity: $71,150,000,000 Putting these numbers into the financial ratio formulas, we can discover our DuPont analysis components: Net Profit Margin: Net Income ($15,409,000,000) ÷ Revenue ($70,074,000,000) = 0.2199, or 21.99% Asset Turnover: Revenue ($70,074,000,000) ÷ Assets ($133,411,000,000) = 0.5252 Equity Multiplier: Assets ($133,411,000,000) ÷ Shareholders' Equity ($71,150,000,000) = 1.8751 With that, we have the three components we need to calculate return on equity: Return on Equity: (0.2199) x (0.5252) x (1.8751) = 0.2166, or 21.66% Without FInancial leverage ROE:: 0.2199 * 0.5252= 11.54 %
Pepsi Co Analysis PepsiCo's 2004 annual report. Since the principles involved are timeless, and I'm feeling a bit nostalgic about it, I'm going to keep it here for you. Revenue: $29,261,000,000 Net Income: $4,212,000,000 Assets: $27,987,000,000 Shareholders’ Equity: $13,572,000,000 Plug these numbers into the financial ratio formulas to get our components: Net Profit Margin: Net Income ($4,212,000,000) ÷ Revenue ($29,261,000,000) = 0.1439, or 14.39% Asset Turnover: Revenue ($29,261,000,000) ÷ Assets ($27,987,000,000) = 1.0455 Equity Multiplier: Assets ($27,987,000,000) ÷ Shareholders’ Equity ($13,572,000,000) = 2.0621 Finally, we multiply the three components together to calculate the return on equity: Return on Equity: (0.1439) x (1.0455) x (2.0621) = 0.3102, or 31.02%
Pepsi Co Analysus Analyzing Our DuPont ROE Results for PepsiCo A 31.02% return on equity was good in any industry back in 2004. Yet, if you left out the equity multiplier to see how much PepsiCo would have earned had it been completely debt-free, you would have discovered that ROE dropped to 15.04%. In other words, for the year ended 2004, 15.04% of the return on equity was due to profit margins and sales, while 15.96% was due to returns earned on the debt at work in the business. If you found a company at a comparable valuation with the same return on equity yet a higher percentage arose from internally-generated sales, it would be more attractive. Compare PepsiCo to Coca-Cola on this basis and it becomes clear, especially after adjusted for the stock options that were then outstanding, that Coke was the stronger brand