Download
1 / 9
90 likes | 521 Vues
Processing Micro CT Bone Density Images. NASA SHARP Student: Paul Nelson NASA Mentor: John DaPonte Ph. D. Team Members: Michael Clark, Elizabeth Wood, Thomas Sadowski, Paul Thomas Southern Connecticut State University (SCSU), Computer Science Department

E N D
Processing Micro CT Bone Density Images NASA SHARP Student: Paul Nelson NASA Mentor: John DaPonte Ph. D. Team Members: Michael Clark, Elizabeth Wood, Thomas Sadowski, Paul Thomas Southern Connecticut State University (SCSU), Computer Science Department Suny Stonybook University NASA SHARP Program
Project Overview • 6 sets of high resolution (10.5µm), 8 sets of low resolution (17.5µm) image stacks of approximately 86 micro CT mouse images of trabeculae before and after exposure to weightlessness • Iterative deconvolution, no pre-processing and Gaussian blur. • Iterative deconvolution was qualitatively better then Gaussian blur and no pre-processing • Provide quantitative verification of the qualitative findings through numerical evaluation of data obtained from a variety of programs Original Image After a few programs including deconvolution
Current Work • Areas of focus for this bone density study include the fractal dimension, entropy enhancement (EME), bone area, bone thickness, SMI , and BV/TV • A majority of these parameters have already been collected for high/low resolution images
Calculations Background • Bone Volume/Tissue Volume (BV/TV)= Total Bone Volume Total Tissue Volume • Structure Model Index (SMI)= 6x(S’xV/S2) S’=Change in Surface Area Caused by Dilation, S=Object Surface Area Before Dilation, V=Initial Volume • Bone Area Pixel Ratio (BAPR)= #of Bone Pixels In Threshold Image Total # of Pixels • Trabecular Thickness Pixel Ratio (TTPR)= # of Bone Pixels In Threshold Image # of Bone Pixels In Skelonized Image
High/Low Res. Conclusions • The average bone thickness for the low resolution images showed a slight thinning for deconvolution and greater thickening by the Gaussian • The deconvolved data was closer to the data with no pre-processing • For the high resolution images this feature is further shown because the Gaussian was thickened greatly and the deconvolved averages to about the same as the no pre-processing • The average bone area for the low resolution image showed trends similar to average bone thickness • This difference is not as large for the Gaussian as in the large for deconvolution in the high resolution images.
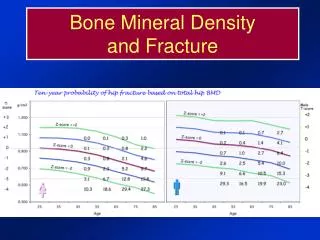
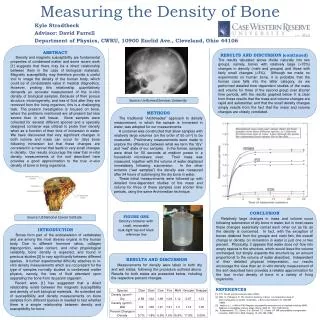
BV/TV Graphs and Conclusions • For BV/TV the bone loss is lower for those mice that experienced more bone loss and higher for those that experienced less bone loss • After suspension occurs, BV/TV always decreases • The SMI appears inversely related to the BV/TV according to these graphs
Future Work • To date, the fractal dimension values have yet to be compiled. Theses parameters will continue to be analyzed to identify any trends that might allow for the separation of more from less bone loss and before and after experiencing weightlessness. • A planned future parameter of study is connectivity analysis.