Download
1 / 21
210 likes | 558 Vues
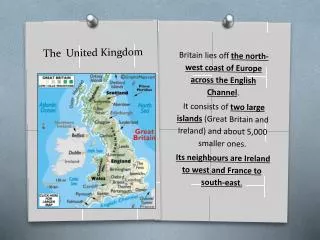
The United Kingdom National Area Classification of Output Areas. Daniel Vickers School of Geography, University of Leeds. What Is An Area Classification?. A segmentation system which groups similar neighbourhoods into categories, based on the characteristics of their residents.

E N D
The United Kingdom National Area Classification of Output Areas Daniel Vickers School of Geography, University of Leeds
What Is An Area Classification? • A segmentation system which groups similar neighbourhoods into categories, based on the characteristics of their residents.
What Is An Output Area? • The smallest area for census output • 223, 060 in the UK • E&W 174,434 min size 40 hholds 100 people • Scotland 42,604 min size 20 hholds 50 people • NI 5,022 min size 40 hholds 100 people
What Goes In? • 41 Census Variables covering: • Age • Ethnicity • Health • Housing Tenure • Household Composition • Employment and Education
Standardising The Data • Log Transformation Why? • Reduces the effect of extreme values (outliers)
Standardising The Data • Range standardisation between 0 -1 Why? Problems will occur if there are differing scales or magnitudes among the variables. In general, variables with larger values and greater variation will have more impact on the final similarity measure. It is necessary to therefore make each variable equally represented in the distance measure by standardising the data.
What Technique Was Used? • Modified K-means clustering • First level run as standard k-means • Second level, first level is split into separate files and each file is clustered separately • Third level, second level is split into separate files and each file is clustered separately
Issues of Cluster Number Selection • When choosing the number of clusters to have in the classification there were three main issues which need to be considered. • Analysis of average distance from cluster distance for each cluster number option. The ideal solution would be the number of clusters which gives smallest average distance from the cluster centre across all clusters. • Analysis of cluster size homogeneity for each cluster number option. It would be useful where possible to have clusters of as similar size as possible in terms of the number of members within each.
Issues of Cluster Number Selection • The number of clusters produced should be as close to the perceived ideal as possible. This means that the number of clusters needs to be of a size that is useful for further analysis. • “At the highest level of aggregation, the cluster groups should be about 6 in number to enable good visualisation and these clusters should also be given descriptive names. • At the next level of aggregation, the number of groups should be about 20. This would be good for conceptual customer profiling. • At the next level of aggregation, the number of groups should be about 50. This can be used for market propensity measures from the larger commercial surveys.” (Martin Callingham Birkbeck College, 2003, Personal Correspondence)
Cluster Selection • A three tier hierarchy 7, 21 & 52 clusters
Cluster Selection • First Level target 6, 7 selected based on analysis of, average distance from cluster centre and size of each cluster. • Second Level target 20, 21 selected based on analysis of, average distance from cluster centre and size of each cluster. • Third Level target 50, 52 selected based on size of each cluster. Split into either 2 or 3 groups
2 4 2 3 3 3 4 What Does The Classification Look Like? 2 2 2 3 3 2 3 3 3 3 2 2 2 2 2 3 3 3 2 3 2 7 52 21
What To Call The Clusters? The naming of the clusters is a near impossible task and on that always provokes much debate however it is a very important one, as if it is done wrong it can a false impression of the people within a cluster. The naming must follow two general principals: 1. Mustn't offend residents 2. Mustn't contradict other classifications or use already established names.
A Look Around The Country • London • Edinburgh • Cardiff • Birmingham • Manchester • Liverpool • Newcastle • Bristol • Bradford • Norwich • Nottingham • Southampton • Glasgow • Dundee
Questions and Comments? You Are Here!