Download
1 / 55
550 likes | 791 Vues
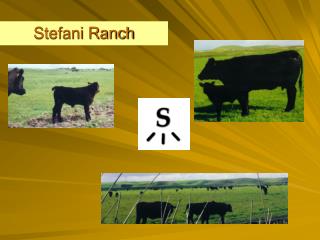
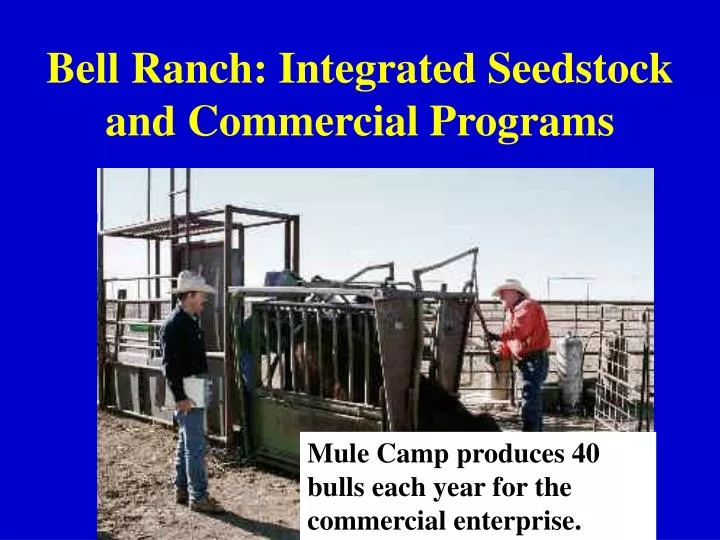
Bell Ranch: Integrated Seedstock and Commercial Programs. Genetics . Mule Camp produces 40 bulls each year for the commercial enterprise. Weaning. Selection is for the weaning weight of the calves 205 days of age. Question.

E N D
Bell Ranch: Integrated Seedstock and Commercial Programs Genetics Mule Camp produces 40 bulls each year for the commercial enterprise.
Weaning Selection is for the weaning weight of the calves 205 days of age
Question If we select for weaning weight and increase the growth potential of our cattle: What will happen to the mature size of our cow herd?
Project Selection for 6 week weight. 3 lines: High growth, Low growth, Control 5 generations of selection
Selection Selection was based on the individuals own performance. h2 of 6 week weight about 50% The accuracy of the selection criteria is 0.70
Lecture 23 Correlated Response
Question: What happens to other traits when selection is for one trait?
Question: What happens to other traits when selection is for one trait? y x
Question: What happens to other traits when selection is for one trait? select on x y Selection Differential for Y x
Correlated Response • change in one trait resulting from selection on another trait
Correlated Response • change in one trait resulting from selection on another trait • response can often be undesirable • example: turkeys
Correlated Response • change in one trait resulting from selection on another trait • response can often be undesirable • example: turkeys • response is based on genetic covariance between traits • BVx,BVy
Correlated Response Why does a genetic covariance exist?
Correlated Response Why does a genetic covariance exist? 1) Pleotrophy -- one gene influences more than one trait (permanent)
Correlated Response Why does a genetic covariance exist? 1) Pleotrophy -- one gene influences more than one trait (permanent) 2) Linkage -- genes influencing two traits physically linked (temporary)
Correlations Positive verses negative correlations Beneficial verses antagonists correlations
Correlated Response bBVy on BVx = BVy,BVx 2BVx
Correlated Response bBVy on BVx= BVy,BVx 2BVx = change in BVy per unit change in BVx
Correlated Response bBVy on BVx = BVy,BVx 2BVx = change in BVy per unit change in BVx CRy = bBVyon BVx G (per generation) = bBVy on BVx g (per year) x x
Superior 3 Huron 2 Ontario 1 Dog = Rowdy
Selection versus Mating Systems
Selection Objective: change gene frequency
Selection Objective: change gene frequency -- Change in frequencies for quantitative traits is slow. --
Genetic Merit = value of individual genes (selection)
Genetic Merit = value of individual genes (selection) + value of gene pairs (mating systems)
Genetic Merit = value of individual genes (selection) + value of gene pairs (mating systems) + value of combination across loci (mating system)
Mating Systems • Planned matings of selected parents
Mating Systems • Planned matings of selected parents • Objective: optimize gene combinations
Mating Systems • Planned matings of selected parents • Objective: optimize gene combinations • Three Example Systems: • Inbreeding • Line breeding • Cross breeding
Inbreeding -- the systematic mating of related animals
Inbreeding -- the systematic mating of related animals generation Full Sibs A B C D 0
Inbreeding -- the systematic mating of related animals generation Full Sibs A B C D 0 E F 1
Inbreeding -- the systematic mating of related animals generation Full Sibs A B C D 0 E F 1 G H 2
Inbreeding Each generation animals become more related to each other, hence each generation the inbreeding coefficient becomes larger. Remember that the inbreeding coefficient is ½ the relationship of the parents.
Inbreeding Fx Generation Selfing F.S. H.S. 0 0 0 0
Inbreeding Fx Generation Selfing F.S. H.S. 0 0 0 0 1 .5 .25 .125
Inbreeding Fx Generation Selfing F.S. H.S. 0 0 0 0 1 .5 .25 .125 2 .75 .38 .220
Inbreeding Fx Generation Selfing F.S. H.S. 0 0 0 0 1 .5 .25 .125 2 .75 .38 .220 … 5 .97 .67 .450
Inbreeding With a line, animals become more similar (uniformity), because gametes of any individual become more similar.
Inbreeding With a line, animals become more similar (uniformity), because gametes of any individual become more similar. Line 1 2 3 F.S. F.S. F.S.
Inbreeding Between lines individuals become more dissimilar (homozygous at different loci for different alleles). Line 1 2 3 F.S. F.S. F.S.
Inbreeding • Using the inbreeding coefficient at generation t, we can estimate: • Within line variation, 2BVW(t) • Between line, 2BVB(t) • Total genetic variation, 2BVT(t)