Download
1 / 1
10 likes | 494 Vues
Patterns of variation in the ontogeny of supraorbital form in species of Homo and Pan . J. Blumenfeld and S.R. Leigh. Department of Anthropology, University of Illinois, Urbana-Champaign, Urbana, IL, USA, 61801. . Discussion

E N D
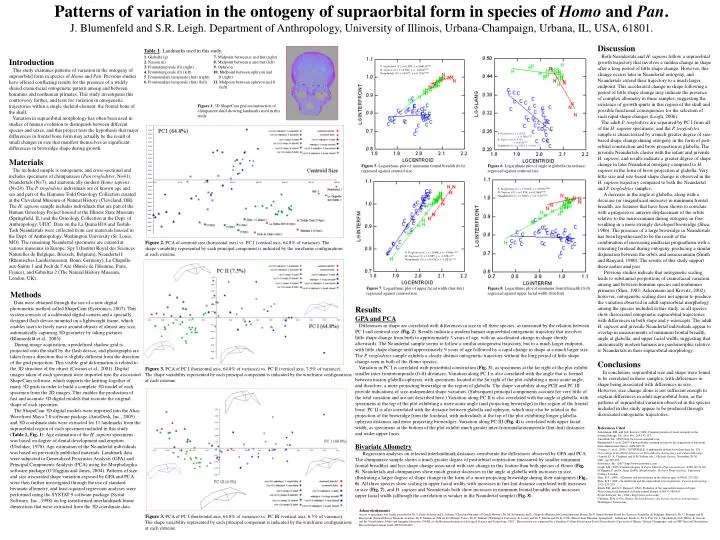
Patterns of variation in the ontogeny of supraorbital form in species of Homo and Pan. J. Blumenfeld and S.R. Leigh. Department of Anthropology, University of Illinois, Urbana-Champaign, Urbana, IL, USA, 61801. Discussion Both Neandertals and H. sapiens follow a supraorbital growth trajectory that involves a sudden change in shape after a long period of little shape change. However, this change occurs later in Neandertal ontogeny, and Neandertals extend their trajectory to a much larger endpoint. This accelerated change in shape following a period of little shape change may indicate the presence of complex allometry in these samples, suggesting the existence of growth spurts in this region of the skull and possible functional consequences for the selection of such rapid shape changes (Leigh, 2006). The adult P. troglodytes are separated by PC I from all of the H. sapiens specimens, and the P. troglodytes sample is characterized by a much greater degree of size-based shape change during ontogeny in the form of post-orbital constriction and brow projection at glabella. The juvenile Neandertals cluster with the infant and juvenile H. sapiens, and results indicate a greater degree of shape change in later Neandertal ontogeny compared to H. sapiens in the form of brow projection at glabella. Very little size and size-based shape change is observed in the H. sapiens trajectory compared to both the Neandertal and P. troglodytes samples. A decrease in the angle at glabella, along with a decrease (or insignificant increase) in minimum frontal breadth, are features that have been shown to correlate with a progressive anterior displacement of the orbits relative to the neurocranium during ontogeny in Pan, resulting in a more strongly developed browridge (Shea, 1986). The presence of a large browridge in Neandertals has been hypothesized to be the result of the combination of increasing midfacial prognathism with a retreating forehead during ontogeny, producing a similar disjunction between the orbits and neurocranium (Smith and Ranyard, 1980). The results of this study support these earlier analyses. Previous studies indicate that ontogenetic scaling leads to substantial proportions of craniofacial variation among and between hominin species and nonhuman primates (Shea, 1983; Ackermann and Krovitz, 2002), however, ontogenetic scaling does not appear to produce the variation observed in adult supraorbital morphology among the species included in this study, as all species show dissociated ontogenetic supraorbital trajectories with differences in both slope and y-intercepts. The adult H. sapiens and juvenile Neandertal individuals appear to overlap in measurements of minimum frontal breadth, angle at glabella, and upper facial width, suggesting that anatomically modern humans are paedomorphic relative to Neandertals in their supraorbital morphology. Conclusions In conclusion, supraorbital size and shape were found to be correlated in these samples, with differences in shape being associated with differences in size. However, size change alone is not sufficient enough to explain differences in adult supraorbital form, as the patterns of supraorbital variation observed in the species included in this study appear to be produced through dissociated ontogenetic trajectories. Table 1.Landmarks used in this study. 1. Glabella (g) 7. Midpoint between n and fmt (right) 2. Nasion (n) 8. Midpoint between n and fmt (left) 3. Frontotemporale (ft) (right) 9. Ophryon 4. Frontotemporale (ft) (left) 10. Midpoint between ophryon and 5. Frontomalare temporale (fmt) (right) ft (right) 6. Frontomalare temporale (fmt) (left) 11. Midpoint between ophryon and ft (left) Introduction This study examines patterns of variation in the ontogeny of supraorbital form in species of Homo and Pan. Previous studies have offered conflicting results for the presence of a widely shared craniofacial ontogenetic pattern among and between hominins and nonhuman primates. This study investigates this controversy further, and tests for variation in ontogenetic trajectories within a single skeletal element: the frontal bone of the skull. Variation in supraorbital morphology has often been used in studies of human evolution to distinguish between different species and sexes, and this project tests the hypothesis that major differences in frontal bone form may actually be the result of small changes in size that manifest themselves as significant differences in browridge shape during growth. P. troglodytes (C): r= 0.088, y = 0.661x0.064 H. sapiens (H): r = 0.982, y = -1.022x0.957 Neandertals (N): r =0.677, y = 0.124x0.409 3 10 9 11 4 5 1 7 8 6 2 Figure 1. 3D ShapeCam grid reconstruction of chimpanzee skull showing landmarks used in this study. P. Troglodytes (C): r =0.711, y =1.568x-0.638 H. Sapiens (H): r =0.339, y =0.651x-0.98 Neandertals (N): r = 0.921, y =3.103x-1.286 Materials The included sample is ontogenetic and cross-sectional and includes specimens of chimpanzees (Pan troglodytes, N=41), Neandertals (N=7), and anatomically modern Homo sapiens (N=24). The P. troglodytes individuals are of known age and sex and part of the Hamann-Todd Osteology Collection curated at the Cleveland Museum of Natural History (Cleveland, OH). The H. sapiens sample includesindividuals that are part of the Human Osteology Project housed at the Illinois State Museum (Springfield, IL) and the Osteology Collection at the Dept. of Anthropology, UIUC. Data on the La Quina H18 and Teshik-Tash Neandertals were collected from cast materials housed in the Dept. of Anthropology, Washington University (St. Louis, MO). The remaining Neandertal specimens are curated at various museums in Europe: Spy I (Institut Royal des Sciences Naturelles de Belgique, Brussels, Belgium), Neandertal I (Rheinisches Landesmuseum, Bonn, Germany), La Chapelle-aux-Saints 1 and Pech de l’Azé (Musée de l'Homme, Paris, France), and Gibraltar 2 (The Natural History Museum, London, UK). Figure 5. Logarithmic plot of minimum frontal breadth (ft-ft) regressed against centroid size. Figure 6. Logarithmic plot of angle at glabella (in radians) regressed against centroid size. P. Troglodytes (C): r = 0.092, y = 0.830x-0.044 H. Sapiens (H): r = 0.956, y = 0.246x0.708 Neandertals (N): r = 0.629, y = 0.713x0.269 Figure 2.PCA of centroid size (horizontal axis) vs. PC I (vertical axis, 64.8% of variance). The shape variability represented by each principal component is indicated by the wireframe configurations at each extreme. P. Troglodytes (C): r = 0.968, y = -1.968x1.474 H. Sapiens (H): r = 0.985, y = -1.678x1.297 Neandertals (N): r = 0.974, y = -1.883x1.376 Figure 7. Logarithmic plot of upper facial width (fmt-fmt) regressed against centroid size. Figure 8. Logarithmic plot of minimum frontal breadth (ft-ft) regressed against upper facial width (fmt-fmt). Methods Data were obtained through the use of a new digital photometric method called ShapeCam (Eyetronics, 2007). This system consists of a calibrated digital camera and a specially designed flash device mounted on a lightweight frame, which enables users to freely move around objects of almost any size, automatically capturing 3D geometry by taking pictures (Blumenfeld et al., 2005). During image acquisition, a predefined shadow grid is projected onto the skull by the flash device, and photographs are taken from a direction that is slightly different from the direction of the grid projection. This visible grid deformation is related to the 3D structure of the object (Cosmas et al., 2001). Digital images taken of each specimen were imported into the associated ShapeCam software, which supports the knitting-together of many 3D grids in order to build a complete 3D model of each specimen from the 2D images. This enables the production of fast and accurate 3D digital models that recreate the original shape of each specimen. The ShapeCam 3D digital models were imported into the Alias Wavefront Maya 7.0 software package (AutoDesk, Inc., 2005) and 3D coordinate data were extracted for 11 landmarks from the supraorbital region of each specimen included in this study (Table 1, Fig.1). Age estimation of the H. sapiens specimens was based on degree of dental development and eruption (Ubelaker, 1978). Age estimation of the Neandertal individuals was based on previously published materials. Landmark data were subjected to Generalized Procrustes Analysis (GPA) and Principal Components Analysis (PCA) using the Morphologika software package (O’Higgins and Jones, 2004). Patterns of size and size-associated shape variation exposed by GPA and PCA were then further investigated through the use of standard bivariate allometry, and least-squared regression analyses were performed using the SYSTAT 9 software package (Systat Software, Inc., 1998) on log-transformed interlandmark linear dimensions that were extracted from the 3D coordinate data. Results GPA and PCA Differences in shape are correlated with differences in size in all three species, as measured by the relation between PC I and centroid size (Fig. 2). Results indicate a modern human supraorbital ontogenetic trajectory that involves little shape change from birth to approximately 5 years of age, with an accelerated change in shape shortly afterwards. The Neandertal sample seems to follow a similar ontogenetic trajectory, but to a much larger endpoint, with little shape change until approximately 9 years of age followed by a rapid change in shape at a much larger size. The P. troglodytes sample exhibits a clearly distinct ontogenetic trajectory without the long period of little shape change seen in both of the Homo species. Variation in PC I is correlated with postorbital constriction (Fig. 3), as specimens at the far right of the plot exhibit smaller inter-frontotemporale (ft-ft) distances. Variation along PC I is also correlated with the angle that is formed between nasion-glabella-ophryon, with specimens located at the far right of the plot exhibiting a more acute angle, and therefore, a more projecting browridge in the region of glabella. The shape variability along PCII and PC III provide indications of size-independent shape variation. (Subsequent principal components account for very little of the total variation and are not described here.) Variation along PC II is also correlated with the angle at glabella, with specimens at the top of the plot exhibiting a more acute angle (and projecting browridge) in this region of the frontal bone. PC II is also correlated with the distance between glabella and ophryon, which may also be related to the projection of the browridge from the forehead, with individuals at the top of the plot exhibiting longer glabella-ophryon distances and more projecting browridges. Variation along PC III (Fig. 4) is correlated with upper facial width, as specimens at the bottom of the plot exhibit much greater inter-frontomalaretemporale (fmt-fmt) distances and wider upper faces. Bivariate Allometry Regression analyses on selected interlandmark distances corroborate the differences observed by GPA and PCA. The chimpanzee sample shows a much greater degree of postorbital constriction(measured by smaller minimum frontal breadths) and less shape change associated with size change in this feature than both species of Homo (Fig. 5). Neandertals and chimpanzees show much greater decreases in the angle at glabella with increases in size, illustrating a larger degree of shape change in the form of a more projecting browridge during their ontogenies (Fig. 6). All three species show scaling in upper facial width, with increases in fmt-fmt distance correlated with increases in size (Fig. 7), and H. sapiens and Neandertalsbothshow increases in minimum frontal breadths with increases upper facial width (although the correlation is weaker in the Neandertal sample) (Fig. 8). Figure 3.PCA of PC I (horizontal axis, 64.8% of variance) vs. PC II (vertical axis, 7.5% of variance). The shape variability represented by each principal component is indicated by the wireframe configurations at each extreme. References Cited Ackermann, R.R.,and G.E. Krovitz (2002) Common patterns of facial ontogeny in the hominid lineage. The Anat. Rec. 269:142-147. AutoDesk, Inc. (2005) http://www.usa.autodesk.com Blumenfeld, J. et al. (2005) A new portable scanning system for the acquisition of data from three-dimensional objects. AJPA S40:78. Cosmas, J., et al. (2001). 3D MURALE: A multimedia system for archaeology. In: The Proceedings of the 2001Conference on Virtual Realty, Archaeology and Cultural Heritage (Arnold, D., A. Chalmers and D.W. Fellner, eds.), Glyfada, Greece, November 28-30, 2001, pp 297-305. Eyetronics, Inc. (2007) http://www.eyetronics.com Leigh, S.R. (2006) Cranial ontogeny of Papio baboons (Papio hamadryas).AJPA 130:71-84. O’Higgins, P. and N. Jones (2004). Morphologika: Tools for Shape Analysis. University College, London. Shea, B.T. (1983). Allometry and heterochrony in the African apes. AJPA 62:275-289. Shea, B.T. (1986). On skull form and the supraorbital torus in primates. Current Anthropology 27(3):257-259. Smith, F.H. and G.C. Ranyard (1980). Evolution of the supraorbital region in Upper Pleistocene fossil hominids in South-central Europe. AJPA 53:589-610. Systat Software, Inc. (1998) http://www.systat.com/ Ubelaker, D.H. (1978). Human Skeletal Remains: Excavation, Analysis, Interpretation. Washington: Taraxacum. Acknowledgements Access to specimens was kindly provided by Dr. Y. Haile-Selassie and L. Jellema (Cleveland Museum of Natural History), Dr. M. Schmauder and L. Giemsch (Rheinisches Landesmuseum, Bonn), Dr. P. Semal (Institut Royal des Sciences Naturelles de Belgique, Brussels), Dr. C. Stringer and R. Kruszynski (Natural History Museum, London), Dr. P. Mennecier (Musée de l'Homme, Paris), Dr. E. Trinkaus (Washington University, St. Louis) and Dr. T. Martin and Dr. D. Cobb (Illinois State Museum, Springfield). Additional thanks to Dr. S. Prat, Dr. L. Shackelford, D.E. Weber, B. Grosser, and the Visualization, Media and Imaging Laboratory (VMIL) at the Beckman Institute for Advanced Science and Technology, UIUC. This research was supported by a Graduate College Dissertation Travel Grant Award (University of Illinois, Urbana-Champaign), and an NSF Doctoral Dissertation Research Improvement Grant (BCS-0622420). Figure 3.PCA of PC I (horizontal axis, 64.8% of variance) vs. PC III (vertical axis, 6.5% of variance). The shape variability represented by each principal component is indicated by the wireframe configurations at each extreme.