Download
1 / 34
360 likes | 872 Vues
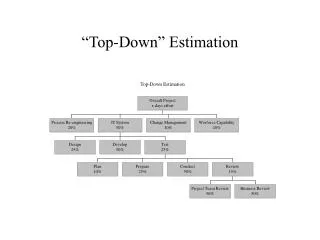
Top Down Investing. Bottom-up Approach Choose under-valued securities Buying performance cheaply Top-Down Approach Build the ideal portfolio Structure portfolio to investor needs May have “expensive” & “cheap” stocks. The Ideal Portfolio. High return Low risk Inexpensive to manage.

E N D
Top Down Investing • Bottom-up Approach • Choose under-valued securities • Buying performance cheaply • Top-Down Approach • Build the ideal portfolio • Structure portfolio to investor needs • May have “expensive” & “cheap” stocks
The Ideal Portfolio • High return • Low risk • Inexpensive to manage
Measures of Return • Total return • After tax income and appreciation • Geometric mean = growth • [V(T) / V(o) ](1/T) - 1
Measures of Risk • Volatility • 2 = variance: average squared deviation from historical mean • Downside Risk • semi-variance: average squared negative deviation from historical mean • Value-at-Risk • Minimum expected loss for a given horizon and probability level
Measures of Expense • Transactions • Information acquisition • Monitoring costs • Probability of losing client
Technology of Return and Risk • Harry Markowitz , 1959 • Reduced investment to two dimensions • Showed that portfolio mix matters most • Turned investing into statistics
Mean and Standard Deviation • Mean measures expected return • Standard deviation measures investor risk • Example: six asset classes 1970 - 1996
Correlation: the Third Statistic • Correlation and co-movement • One asset “hedges” the other • Two assets are better than one
Gold and the Stock Market • Correlation of -.3 since 1970 • Hedged 70’s crash
Gold in the Portfolio? • 25% risk reduction • 3/4 stocks, 1/4 gold • Is gold dominated?
The Efficient Frontier • More assets move frontier • Frontier is a continuous set of efficient portfolios • Highest return for each level of risk
The First Frontier • Markowitz took stocks from the NYSE • Mixed them with cash • Created the first frontier
Risk and Return Inputs N Periods Geometric Arithmetic Standard Mean (%) Mean (%) Deviation (%) MSCI Automobiles Cap App 324.00 8.16 9.97 20.07 MSCI Banking Cap App 324.00 10.74 12.56 20.64 MSCI Chemicals Cap App 324.00 7.94 9.34 17.53 MSCI Energy Sources Cap App 324.00 9.18 10.84 19.33 MSCI Gold Mines Cap App 324.00 7.67 15.91 46.01 MSCI Telecomm Cap App 324.00 6.68 7.62 14.25 MSCI Textiles & Apparel Cap App 324.00 6.20 8.16 20.88 MSCI Transport - Airlines Cap App 324.00 7.40 10.25 25.51 MSCI Utilities - Elec&Gas Cap Ap. 324.00 5.97 7.03 15.29
Value at Risk • How much do I expect to lose 1 in 20 times? • E.G. VAR for a $100 million portfolio with a std. of 12% at the 1/20 confidence level is: • VAR = $100m * 1.64 * 12% - 8% = 12%
Value at Risk Minimum expected annual loss at a 95% confidence level for the lowest risk portfolio = -12%
New Risk Technology • VAR with simulations • VAR with non-normal returns • VAR with derivatives • VAR with chaotic systems
Systematic Risk • Non-diversifiable risk • Market risk • Beta risk
Portfolio Investors • Diversify away most risk • Demand return only for residual • Have advantage over non-diversified investors • Can bid more for risky assets • Have less volatile portfolios
Portfolio Investors’Expected Returns • Only market exposure matters • Higher means higher expected return
Factor Models • Assume price-setters are diversified • Ignore diversifiable risk • Expected return must compensate remaining risk • “Factors” are risk sources
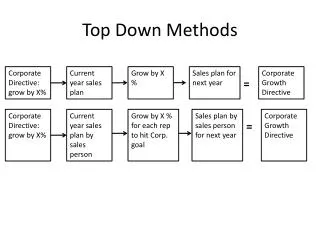
Developing a Top-Down Portfolio • Assess sensitivity of client to: • inflation shocks • interest rate shifts • GDP shocks • Tilt portfolio away from stocks matching firm sensitivity • Capture factor exposure with minimum transactions costs
Example • Client is the pension fund of an international oil company • defined benefits • ability to contribute depends upon oil prices • Exposure to oil shocks • APT allows them to “hedge” oil shocks • Analysis lets them tilt towards risks they care less about
Measuring Beta • Linear “Response” to Factor Returns • Example: MSCI is about a 50% “hedge” of the S&P 500. • Better Fit = Better Hedge
Multi-Factor Models • APT = Macro-economic risk factors • BARRA = Security-specific risk factors • Fama-French = Size and book to market ratio as risk
Arbitrage Pricing Theory • Chen, Roll and Ross factors are: • Production risk • Inflation shocks • term structure shifts • investor confidence • Explanatory factors • Fundamental economic forces drive stocks
BARRA factor models • Stock characteristics: • Earnings • Leverage • Growth • Sales • No common factors • model works to explain returns
Fama and French Factors • Size • Small stocks have a premium • Book to market • A “distress” premium? • These beat S&P beta
New Directions in Asset Pricing • Statistical methods for identifying factors • Style analysis • Economic modeling of risk • International Factors • Diversity of markets • Diversity of environments • Diversity of historical experiences