Download
1 / 10
110 likes | 1.03k Vues
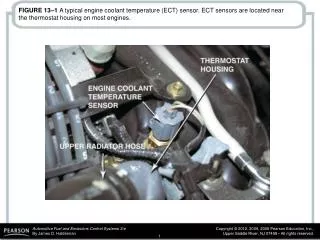
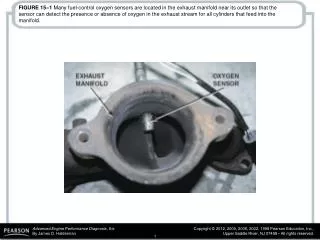
Figure 15.1 A typical engine coolant temperature (ECT) sensor. ECT sensors are located near the thermostat housing on most engines. Figure 15.2 A typical ECT sensor temperature versus voltage curve.

E N D
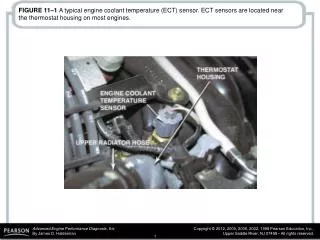
Figure 15.1 A typical engine coolant temperature (ECT) sensor. ECT sensors are located near the thermostat housing on most engines.
Figure 15.2 A typical ECT sensor temperature versus voltage curve.
Figure 15.3 A typical two-step ECT circuit showing that when the coolant temperature is low, the PCM applies a 5-volt reference voltage to the ECT sensor through a higher resistance compared to when the temperature is higher.
Figure 15.4 The transition between steps usually occurs at a temperature that would not interfere with cold engine starts or the cooling fan operation.
Figure 15.6 When the voltage drop reaches approximately 1.2 volts, the PCM turns on a transistor.
Figure 15.7 An ECT sensor being tested using a digital meter set to DC volts and in record mode.
Figure 15.8 The IAT sensor on this General Motors 3800 V-6 engine is in the air passage duct between the air cleaner housing and the throttle body.