Download
1 / 1
10 likes | 349 Vues
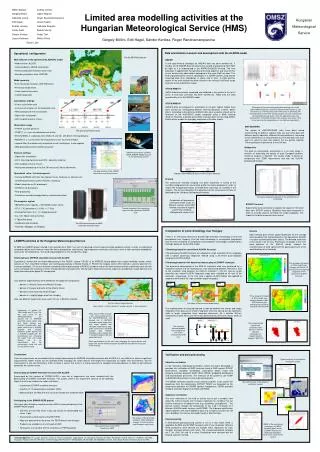
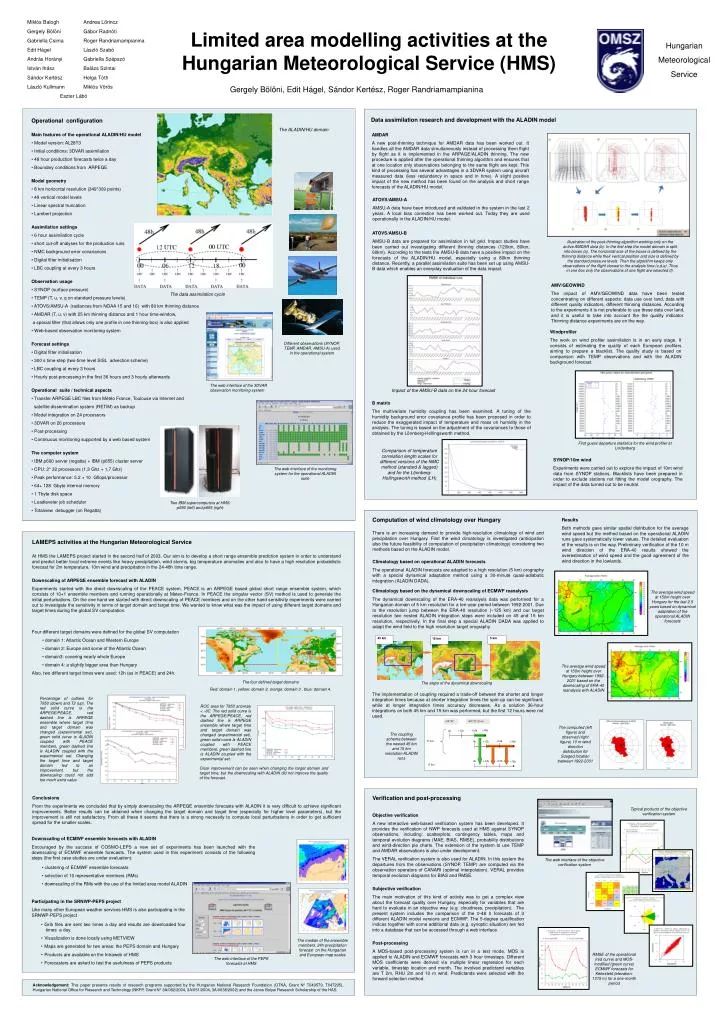
45 km. 5 km. 15 km. The four defined target domains Red: domain 1, yellow: domain 2, orange: domain 3 , blue: domain 4. 00UTC. 00UTC (D+1). +36h. +24h. +12h. 0h. 45 km. +24h. 0h. +12h. +36h.

E N D
45 km 5 km 15 km The four defined target domains Red: domain 1, yellow: domain 2, orange: domain 3 , blue: domain 4. 00UTC 00UTC (D+1) +36h +24h +12h 0h 45 km +24h 0h +12h +36h Percentage of outliers for T850 (down) and T2 (up). The red solid curve is the ARPEGE/PEACE, red dashed line is ARPEGE ensemble where target time and target domain was changed (experimental set), green solid curve is ALADIN coupled with PEACE members, green dashed line is ALADIN coupled with the experimental set. Changing the target time and target domain led to an improvement, but the downscaling could not add too much extra value. +24h 0h +12h +36h 15 km Miklós Balogh Gergely Bölöni Gabriella Csima Edit Hágel András Horányi István Ihász Sándor Kertész László Kullmann Eszter Lábó Andrea Lőrincz Gábor Radnóti Roger Randriamampianina László Szabó Gabriella Szépszó Balázs Szintai Helga Tóth Miklós Vörös Limited area modelling activities at the Hungarian Meteorological Service (HMS) Hungarian Meteorological Service Gergely Bölöni, Edit Hágel, Sándor Kertész, Roger Randriamampianina • Operational configuration • Main features of the operational ALADIN/HU model • Model version: AL28T3 • Initial conditions: 3DVAR assimilation • 48 hour production forecasts twice a day • Boundary conditions from ARPEGE • Model geometry • 8 km horizontal resolution (349*309 points) • 49 vertical model levels • Linear spectral truncation • Lambert projection • Assimilation settings • 6 hour assimilation cycle • short cut-off analyses for the production runs • NMC background error covariances • Digital filter initialisation • LBC coupling at every 3 hours • Observation usage • SYNOP (surface pressure) • TEMP (T, u, v, q on standard pressure levels) • ATOVS/AMSU-A (radiances from NOAA 15 and 16) with 80 km thinning distance • AMDAR (T, u, v) with 25 km thinning distance and 1 hour time-window, • a special filter (that allows only one profile in one thinning-box) is also applied • Web-based observation monitoring system • Forecast settings • Digital filter initialisation • 300 s time-step (two-time level SISL advection scheme) • LBC coupling at every 3 hours • Hourly post-processing in the first 36 hours and 3 hourly afterwards • Operational suite / technical aspects • Transfer ARPEGE LBC files from Météo France, Toulouse via Internet and • satellite dissemination system (RETIM) as backup • Model integration on 24 processors • 3DVAR on 26 processors • Post-processing • Continuous monitoring supported by a web based system • The computer system • IBM p690 server (regatta) + IBM (p655) cluster server • CPU: 2* 32 processors (1,3 Ghz + 1,7 Ghz) • Peak performance: 5.2 + 10 Gflops/processor • 64+ 128 Gbyte internal memory • 1 Tbyte disk space • Loadleveler job scheduler • Totalview debugger (on Regatta) • Data assimilation research and development with the ALADIN model The ALADIN/HU domain AMDAR A new post-thinning technique forAMDAR data has been worked out. It handles all the AMDAR data simultaneously instead of processing them flight by flight as it isimplemented in the ARPAGE/ALADIN thinning. The new procedure is applied after the operational thinning algorithm and ensures that at one location only observations belonging to the same flight are kept. This kind of processing has several advantages in a 3DVAR system using aircraft measured data (less redundancy in space and in time). A slight positive impact of the new method has been found on the analysis and short range forecasts of the ALADIN/HU model. ATOVS/AMSU-A AMSU-A data have been introduced and validated in the system in the last 2 years. A local bias correction has been worked out. Today they are used operationally in the ALADIN/HU model. ATOVS/AMSU-B AMSU-B data are prepared for assimilation in full grid. Impact studies have been carried out investigating different thinning distances (120km, 80km, 60km). According to the tests the AMSU-B data have a positive impact on the forecasts of the ALADIN/HU model, especially using a 80km thinning distance. Recently, a parallel assimilation suite has been set up using AMSU-B data which enables an everyday evaluation of the data impact. Illustration of the post-thinning algorithm working only on the active AMDAR data (b). In the first step the model domain is split into boxes (a). The horizontal size of the boxes is defined by the thinning distance while their vertical position and size is defined by the standard pressure levels. Then the algorithm keeps only observations of the flight closest to the analysis time (c,d,e). Thus in one box only the observations of one flight are selected (f). AMV/GEOWIND The impact of AMV/GEOWIND data have been tested concentrating on different aspects: data use over land, data with different quality indicators, different thinning distances. According to the experiments it is not preferable to use these data over land, and it is useful to take into account the the quality indicator. Thinning distance experiments are on the way. The data assimilation cycle Windprofiler The work on wind profiler assimilation is in an early stage. It consists of estimating the quality of each European profilers aiming to prepare a blacklist. The quality study is based on comparison with TEMP observations and with the ALADIN background forecast. Different observations (SYNOP, TEMP, AMDAR, AMSU-A) used in the operational system The web interface of the 3DVAR observation monitoring system Impact of the AMSU-B data on the 24 hour forecast B matrix The multivariate humidity coupling has been examined. A tuning of the humidity background error covariance profile has been proposed in order to reduce the exaggerated impact of temperature and mass on humidity in the analysis. The tuning is based on the adjustment of the covariances to those of obtained by the Lönnberg-Hollingsworth method. First guess departure statistics for the wind profiler at Lindenberg Comparison of temperature correlation length scales for different versions of the NMC method (standard & lagged) and for the Lönnberg-Hollingsworth method (LH) SYNOP/10m wind Experiments were carried out to explore the impact of 10m wind data from SYNOP stations. Blacklists have been prepared in order to exclude stations not fitting the model orography. The impact of the data turned out to be neutral. The web interface of the monitoring system for the operational ALADIN suite Two IBM supercomputers at HMS: p690 (left) and p655 (right) Computation of wind climatology over Hungary There is an increasing demand to provide high-resolution climatology of wind and precipitation over Hungary. First the wind climatology is investigated (anticipation also the future feasibility of computation of precipitation climatology) considering two methods based on the ALADIN model. Climatology based on operational ALADIN forecasts The operational ALADIN forecasts are adapted to a high resolution (5 km) orography with a special dynamical adaptation method using a 30-minute quasi-adiabatic integration (ALADIN DADA). Climatology based on the dynamical downscaling of ECMWF reanalysis The dynamical downscaling of the ERA-40 reanalysis data was performed for a Hungarian domain of 5 km resolution for a ten-year period between 1992-2001. Due to the resolution jump between the ERA-40 resolution (~125 km) and our target resolution two nested ALADIN integration steps were included on 45 and 15 km resolution, respectively. In the final step a special ALADIN DADA was applied to adapt the wind field to the high resolution target orography. Results Both methods gave similar spatial distribution for the average wind speed but the method based on the operational ALADIN runs gave systematically lower values. The detailed evaluation of the results is on the way. Preliminary verification of the 10 m wind direction of the ERA-40 results showed the overestimation of wind speed and thegood agreement of the wind direction in the lowlands. LAMEPS activities at the Hungarian Meteorological Service At HMS the LAMEPS project started in the second half of 2003. Our aim is to develop a short range ensemble prediction system in order to understand and predict better local extreme events like heavy precipitation, wind storms, big temperature anomalies and also to have a high resolution probabilistic forecast for 2m temperature, 10m wind and precipitation in the 24-48h time range. Downscaling of ARPEGE ensemble forecast with ALADIN Experiments started with the direct downscaling of the PEACE system. PEACE is an ARPEGE based global short range ensemble system, which consists of 10+1 ensemble members and running operationally at Meteo-France. In PEACE the singular vector (SV) method is used to generate the initial perturbations. On the one hand we started with direct downscaling of PEACE members and on the other hand sensitivity experiments were carried out to investigate the sensitivity in terms of target domain and target time. We wanted to know what was the impact of using different target domains and target times during the global SV computation. The average wind speed at 150m height over Hungary for the last 2.5 years based on dynamical adaptation of the operational ALADIN forecasts • Four different target domains were defined for the global SV computation • domain 1: Atlantic Ocean and Western Europe • domain 2: Europe and some of the Atlantic Ocean • domain3: covering nearly whole Europe • domain 4: a slightly bigger area than Hungary • Also, two different target times were used: 12h (as in PEACE) and 24h. The average wind speed at 150m height over Hungary between 1992-2001 based on the downscaling of ERA-40 reanalysis with ALADIN The steps of the dynamical downscaling The implementation of coupling required a trade-off between the shorter and longer integration times because at shorter integration times the spin-up can be significant, while at longer integration times accuracy decreases. As a solution 36-hour integrations on both 45 km and 15 km was performed, but the first 12 hours were not used. ROC area for T850 anomaly < -8C. The red solid curve is the ARPEGE/PEACE, red dashed line is ARPEGE ensemble where target time and target domain was changed (experimental set), green solid curve is ALADIN coupled with PEACE members, green dashed line is ALADIN coupled with the experimental set. The computed (left figure) and observed (right figure) 10 m wind direction distribution for Szeged location between 1992-2001 The coupling scheme between the nested 45 km and 15 km resolution ALADIN runs Clear improvement can be seen when changing the target domain and target time, but the downscaling with ALADIN did not improve the quality of the forecast. Verification and post-processing Objective verification A new interactive web-based verification system has been developed. It provides the verification of NWP forecasts used at HMS against SYNOP observations, including: scatterplots, contingency tables, maps and temporal evolution diagrams (MAE, BIAS, RMSE), probability distributions and wind-direction pie charts. The extension of the system to use TEMP and AMDAR observations is also under development. The VERAL verification system is also used for ALADIN. In this system the departures from the observations (SYNOP, TEMP) are computed via the observation operators of CANARI (optimal interpolation). VERAL provides temporal evolution diagrams for BIAS and RMSE. Subjective verification The main motivation of this kind of activity was to get a complex view about the forecast quality over Hungary, especially for variables that are hard to evaluate in an objective way (e.g. cloudiness, precipitation). The present system includes the comparison of the 0-48 h forecasts of 3 different ALADIN model versions and ECMWF. The 5-degree qualification indices together with some additional data (e.g. synoptic situation) are fed into a database that can be accessed through a web interface. Post-processing A MOS-based post-processing system is run in a test mode. MOS is applied to ALADIN and ECMWF forecasts with 3 hour timesteps. Different MOS coefficients were derived via multiple linear regression for each variable, timestep location and month. The involved predictand variables are T 2m, RHU 2m and 10 m wind. Predictands were selected with the forward selection method. Conclusions From the experiments we concluded that by simply downscaling the ARPEGE ensemble forecasts with ALADIN it is very difficult to achieve significant improvements. Better results can be obtained when changing the target domain and target time (especially for higher level parameters), but the improvement is still not satisfactory. From all these it seems that there is a strong necessity to compute local perturbations in order to get sufficient spread for the smaller scales. Typical products of the objective verification system • Downscaling of ECMWF ensemble forecasts with ALADIN • Encouraged by the success of COSMO-LEPS a new set of experiments has been launched with the downscaling of ECMWF ensemble forecasts. The system used in this experiment consists of the following steps (the first case studies are under evaluation): • clustering of ECMWF ensemble forecasts • selection of 10 representative members (RMs) • downscaling of the RMs with the use of the limited area model ALADIN The web interface of the objective verification system Participating in the SRNWP-PEPS project Like many other European weather services HMS is also participating in the SRNWP-PEPS project • Grib files are sent two times a day and results are downloaded four times a day • Visualization is done locally using METVIEW • Maps are generated for two areas: the PEPS domain and Hungary • Products are available on the Intraweb of HMS • Forecasters are asked to test the usefulness of PEPS products The median of the ensemble members, 24h precipitation forecast on the Hungarian and European map scales RMSE of the operational (red curve) and MOS-modified (green curve) ECMWF forecasts for Kékestető (elevation: 1015 m) for a one-month period The web interface of the PEPS forecasts at HMS Acknowledgement: This paper presents results of research programs supported by the Hungarian National Research Foundation (OTKA, Grant N° T049579, T047295), Hungarian National Office for Research and Technology(NKFP, Grant N° 3A/082/2004, 3A/051/2004, 3A/0038/2002) and the János Bolyai Research Scholarship of the HAS.