Download
1 / 31

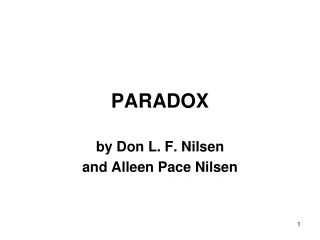
E N D
The Paradox System was built for one purpose; to make money and work from home. For me trading is a business and not a hobby, and I really dislike working more than 4 hours a day. My goal for each trading day is 40 pips profit compounding. And when I reached that goal; I am finished until the next day. One thing I have learned; and that is greed is a destructive force for any trader. So on the wayside this system is not for everyone. The Paradox System has 3 charts; 1 hour, 2 hour, and the Daily. You do not need any chart below the 1 hour, or above the Daily. The 1 hour is your trading chart. The 2 hour is reference in changing of trends. The Daily is reference for long term trend and reference with support and resistance. Meaning of Paradox: : something (such as trading) that is made up of two opposite things and seems impossible but is actually true or possible. What this is referring too in trading is Support and Resistance. And I do not mean drawing lines. When the market moves from bar to bar; it is also creating new S/R. And in reality; Support/ Resistance are two opposites and seem impossible to trade; but are actually true and possible to trade. And how is it possible? It is known as trading in the moment. The closing of each bar is past history and no-longer has value. BUT each bar creates a new support and/or resistance. And this is what the Paradox is all about. Support and resistance is a phenomenon for traders. Sure you can draw your lines for the highs and lows; but what happens between those lines is what matters. Between those lines is a constant support and resistance being created from bar to bar. And the Paradox is what creates those support and resistance between those lines. I started with the Paradox in the mid-2000 with a platform called Intellicharts. I eventually changed brokers and went with FXSolutions which had AccuCharts. And with AccuCharts I was able to develop and create the Paradox as it is today. But eventually FXSolutions got tired of the entire BS in which the USA had implemented in how we were to trade; so they packed it all up and left the country. 2 months later FXSolutions Accucharts was history; unless you wanted to pay a monthly fee for it with the companys developer. Even then you got a bad deal because the companys AccuCharts are not the same as they were with FXSolutions. The reason was because of the programmer FXSolutions had; and he would program AccuCharts according to the traders needs. The platform I eventually decided upon to recreate the Paradox was NinjaTrader 7. And it is the same today as it was on Accucharts.
But over two years ago I decided to try and create the Paradox on MT4. Since MT4 is very limited on programming in creating bases and other criteria for the Paradox it became a challenge. But eventually the challenge became a success. I had to leave out some criteria and added others for it to become a Paradox. Through the years I have trained 100s of traders with the Paradox. And now I am in my old age, going on 71; and it is time to pass on the Paradox. The version Paradox I am giving away is the MT4. If you follow the rules and not be looking for short-cuts you can become a very successful trader with the Paradox, and no longer need to be here on the FF forum; or any other form for that matter. The greatest rule for trading is in the moment; and the moment means - trading one bar at a time. Not what happened yesterday, or a year ago, not even the last bar. But on the 2 hour candle bar that is moving. That 2 hour candle is the actual Moment candle and you have 2 hours to trade it. This is not an over-night success as it takes time to learn how to trade in the moment. So be looking at 6 months of your time in learning to trade in the moment. If you give yourself time with patience you can trade the Paradox with at least 80+% weekly profits. The Paradox is not a complicated system. In fact it is pretty simple provided you are patient and follow the rules. The problem with most traders is the garbage they had accumulated from other traders believing they have all the answers. It becomes evident of this fact when you have a trader wanting to change a proven system. What you do with this system is entirely on you. But if you want to become a trader that can virtually beat the market; then listen to my instructions very carefully. To begin with here are the 3 charts in which you will be trading. 60 Chart
120 chart: And I know what you are thinking Oh no another Moving Average System. Well I hate to dispute your thinking; but it is far from a moving average system. This system is coded to create support and resistance as the market creates its own variations. And Moving Averages cannot create anything with its lagging; causing you to miss trade after trade. But The Paradox is set up to look into the future with a special coding along with multiple sound and visual alerts as not to be missing those trades. And trading in the moment you can catch those trades according to support and resistance within the Paradox. 80% of the market is in consolidation. And most traders have no idea how to trade consolidation. But the Paradox can very well teach you according to (again); support and resistance. And the reason is; when the market is in consolidation then it is all about support and resistance. In fact I enjoy trading consolidated periods. One thing I recommend very heavily on is creating a new sound for alert.wav in your MT4 sound folder. And you make this new sound with one of your favorite songs. The reason is because; that little beep you hear is not enough sound for notification if you were away from your computer. The lacking of not hearing the alert is enough for you to lose the trades. OK Lets move on with installing the Paradox. Below there are 3 zip files: Indicators, Templates, and the Period Converter for creating the 2 hour chart. In the Indicator zip file there is a word doc for installing and formatting the indicators; another word doc in the Period Converter for creating the 2 hour chart.
First thing I would do is create a Paradox Folder in your Documents. Then create 3 sub- folders Indicators, Templates, and Period Converter in order to unzip each zip file. After unzipping the files in their folders read Installing the Paradox doc first thing; as it is the first step to installing the System The Paradox System is very simple and very profitable provided you trade according to the rules. The system is for intraday trading, and set up for taking 40 pips each day. 40 pips compounding daily will guide you beyond your dreams. But the first and most important rule is NEVER trade against the trend. And what is trend? Your major chart trend is ROMAR. Your secondary chart trend is EMA; and your entry chart trend is Smooth. Here is a picture of the 6 indicators for the Paradox: 1 ROMAR 2 Purple 3 White 4 Smooth 5 EMA 6 Parabolic ROMAR: ROMAR is the key trend for the market. Above EMA the trend is down; below EMA the trend is up. You will never have to guess which way the trend is running. You now have a visual. When all 3 charts are in consistent - above or below EMA the market is in that trend. When one of the 3 charts is out of sync with ROMAR the market is in consolidation.
The 2 hour chart ROMAR is the true source for trading the trend. When the 1 hour ROMAR is running through the center of the market you are pretty much in consolidation with the 2 hour trend. The Daily ROMAR is the key when the market will turn direction. Once it crosses Purple the game is over and time to be looking at the opposite direction for long term. ROMAR is also both Support and Resistance on all three charts. The Parabolic's: The Parabolic's with this system is a deadly weapon as they are not standard. And the reason is because they are not taken out with the candles but with a hidden LR. Which means; they are a heavy support and resistance. If the PSARs are in an uptrend and the market opens below a Parabolic, and the Parabolic did not flip; then the next candle will continue in the uptrend and vice-versa. Signal for a parabolic flip is when the Parabolic is at EMA for the Purple crossing. Purple and White: They are both the charts swing trend which accumulates 20-40+ pips on the crossings. They are also Support and Resistance and can hold the market in trend, and/or consolidation before the reverse takes place. Smooth: Smooth is pretty sophisticated. It can hold the market in the short term trend by sliding under or over Purple according to the trend while in consolidation. If Smooth stays below Purple in consolidation then the trend is up. If Smooth is above Purple in consolidation then the trend is down. So be sure your chart is wide open horizontally when the three Purple, White, and Smooth are tight. Smooth is also both Support and Resistance. And while I am thinking about it DO NOT SPREAD YOUR CHARTS OUT TOO ETERNITY (VERTICALLY). Keep them as tight as they can be or you will never to be able to trade in the moment. EMA: EMA is your trend indicator with Purple for the swings. EMA below Purple the trend is up in the swings. EMA above Purple the trend is down in the swings.
EMA also separates uptrend/downtrend within the market. In consolidation EMA will decide what the market will do next. And it could get pretty nasty in a long term consolidation leaving no options for trading. Lets say you have EMA holding support for the uptrend. And you have Purple, White, and Smooth holding Resistance and they are only a few pips spread between support and resistance. What would you do? The answer is waiting on the breakout. And again; EMA is both Support and Resistance. Purple, White, Smooth, PSAR: Your four trading indicators Purple, White, Smooth, and PSAR are the resources for your profit. These 4 horsemen deliver the visual of each swing. White and Smooth must cross Purple before a trade can be taken. And in a slider (consolidation) EMA must also cross Purple for a reversal. If not; then the slider will continue in the original trend. And you use the 2 hour chart for this reference. A consolidated market can be as much as 8-10 hours; sometimes - even longer. Fibo: The Fibo is automated and drawn from the highest/high in the currently visibly bars to the lowest/low and vice-versa. The contour lines are to show the basic range that the pair is trading in. Every time the Fibo flips the colors changes also; Red to Green and vice-versa. If you do not know how to trade Fibos, then I suggest in learning. The Fibos is a great assess for your trading. MACD: The Paradox MACD is set up for the zero line. When the bars are above the 0 line the market is up and vice-versa. Little White arrows with sound alerts will appear in giving you signals of the crossing. Swings: Now lets talk about the various Swings in the market. Even in trend you have swings one after another. And what is good about swings they are either higher/high, or lower/low, according to the trend. A major problem with swings is getting in a trade too soon; especially in a downtrend. Once
the market is in a downtrend it can go on forever; as it seems. You constantly get retraces back to one of the Resistance (either Purple/white or Smooth), and it is off running downhill once again. So there are two variations lines for the swing; DodgerBlue and Magenta. DodgerBlue is for the longer term of the swing and Magenta is for the shorter term known as the SAR. The SAR swing is a modify concept using lines instead of dots; which works very well in ranging. The SAR will take you in and out of a trade and back into the market with the trend. And the best way to trade these swing is always know the trend. If the trend is down you trade from the top if the trend is up you trade from the bottom. This way you never get caught in a losing trade. Each highs and lows are tagged with a small rectangle box with the price showing. There are three color boxes: Lime, Magenta, and Thistle. Lime is the low and Magenta is the high of the swings. Thistle is the SAR High and Low within the primary swings of high and low. You see 2 Dash lines: Magenta and LightSkyBlue. These Dash lines represent the high and low of the primary swings. You also see a Green and Gold DashDot lines which represent the Paradox divergence. There is also a top and bottom Contour lines which is used as ranging for breakouts. They move according to support and resistance of the trend. Also included is a thin Red CP (Central Pivot) line attached to each candle from bar to bar; generated from the top or the bottom of the candle. This line will disappear when one, or both, of the Swing lines are attached. Alerts: This system is set up for 17:00 New York Time; which means after 17:00 EST you must reboot your MT4 platform (close and open it). If not you will run into problems. There are variables as for alerts: You have the EMA alert (Green and Red Arrows); crossing zero of the MACD (Smaller White Arrows); and the market crossing of the MA (Smaller Coral Arrow) with STRONG BUYS and STRONG SALES. All these alerts are attached to the alert.wav in your sound folder. Now when the alert goes off for the market crossing EMA one of three things will happen. Number one - the sound alert will activate before the arrow shows because the hidden target has not been hit yet.
Number Two - with retraces off the MA and EMA Indicators the arrow will disappear but does not mean the arrows are not there. Number Three - the arrow will stay if the market continues on with the trend. The small White Arrows are for the zero crossings of the MACD. When the Market is crossing the MA lines the sound will alert you with a small Coral Arrow. As for the MA alert it is set up on the 1 hour chart only, The MA are identical on both the 1 and 2 hour charts. There is no repainting on these Arrows. Once they are there they are there. There are only 3 alerts with EMA, MA, and the MACD zero. The 1 hour has all three; the 2 hour and Daily has only EMA and the MACD. So check all three charts to see which alert had been activated. During consolidation those alerts will keep you busy. In context the alerts will happen on the 1 hour before the 2 hour. Last but not least - The Bollinger Bands: The Bollinger Bands are also a deadly weapon during consolidation; it will do one of two things when the market hits the bands. It will either retrace back to EMA or retrace back to the opposite band; this happens when the bands are flat which places the market in consolidation. If you do get a hit on one of the bands during consolidation then get in and take profit at least to EMA In a downtrend is a different story. Once the band is hit retrace are generally to Purple, White, or Smooth. When it gets ready to turn then the market will hit EMA and go into consolidation. On an uptrend retraces off the band are generally to EMA for profit. Trading in the moment: Trading in the moment means trading a one bar 2 hour candle. A lot can happen within a two hour period. I have seen many times a 2 hour candle give up between 60+ pips. Thats
not bad for a days work of only 2 hours. When the 2 hour chart is in trend then all you need to do is find a good resource point off the 1 hour for your entry. If the 2 hour is in consolidation then trade the 2 hour off support and resistance for your entries. But I recommend you trade the ROMAR trend in consolidation or else, you may get caught in a wrong trade with a breakout. I also highly recommend to never trading multiple pairs with this system. One reason the alerts will drive you crazy and another it is impossible to trade multiple pairs because you no longer have focus. Trading multiple pairs is like shooting at a target in the dark and hoping for the best. The Rules for This System: Rule 1 - is the 40/40 or 20/40 rule. This means your trade profit and trade lost. Which are 40 profits and a 40 stop and/or, 20 profits and a 40 stop? In the beginning you should use the 20/40 rule. Your goal is 40 pip profits per trading day, and with the 20/40 rule you are looking for two trades per day. You always use a 40 pip stop and you never move it. Now if you are trading in the trend then that 40 stop will never be hit. Rule 2 - is when you have accumulated your 40 a day pips, you then leave your trading station and do not return until the next day. If you get greedy you will become a looser. Compounding 40 pips Daily can make you very wealthy; so do not get greedy. Rule 3 - Do not ever anticipate what you THINK is going to happen in the market. If you trade the indicators you will always be a winner. If you anticipate you could very well end up in a losing trade. Rule 4 - Never, ever trade in a volatile market. Once you get the Spread in a 1.8 2.0+; is because of some unknown reason and you could be in trouble with the wrong trade. I recommend to never be trading in a major news release. If you are in a trade before a major release then take profit at the minimum of 5 minutes before the release. Rule 5 - Always trade a demo until you have reached at least an 80% profit with this System. Learn to trade this System before you even think of trading a live account. Rule 6 - before you start to trade always create a trading plan. The question is: How could you trade without knowing what the market is doing? When I am on this forum I always see these questions. What do you think is going to happen next? Are you trading long or short? Do you think it will break this price, or that price? I believe this down, or up, is finished; what do you think? And such questions just keep being posted. These are traders that do not have a trading plan.
Creating a trading plan is simple and not complicated. Your plan would be consistent with the trend on the 2 hour chart. And according to the plan your entry point would be created within the sync off both 1 and 2 hour charts of the trend. Not complicated at all. Example: 2 hour chart ROMAR down or up Smooth down or up EMA down or up 1 hour chart ROMAR down or up Smooth down or up EMA down or up Daily chart ROMAR down or up Smooth down or up EMA down or up If the 1 hour is in sync with the 2 hour then you have a short trend. If the 1 hour is not consistent with the 2 hour then you are in consolidation. Then you wait until the 1 hour is consistent with the 2 hour before you get into a trade. This is how you learn where support and resistance is located according to the Paradox. The Daily will give you the reference of support and resistance within the Daily as to where they are located. You create notes with your plan on the point of entry as the market is moving. Retraces are valuable as they will hit the trend indicators and is a point of entry for at least 20 pips if the trend has already bloomed. Or 40 pips if the trend had just begun. Provided you do not counter-trade you will always make money in the trend. Templates: Each chart is set individually. And there are 4 indicators must be set true for each chart: 1. Paradox_Trend_EMA_Alert; the Input tab with SoundOn is true and the TimeFrame is for
the chart it is designated for which is in minutes. 2. Paradox_MACD_ZeroCrossing; the Input tab with UserAlert is true. 3. Paradox_Session_Indicator; the session lines are for all 4 of your sessions (Sydney, Tokyo, London, and New York). The charts are set up for Sydney which is 17:00 EST. How you set up the correct session on your charts is according to your broker. And checking your time bar on your chart below will give you the brokers time in GMT. My time zone is EST and my brokers chat time is set 22:00 GMT at the 17:00 EST NY mark; which is 5 GMT ahead of New York. So that means that the label gmtServerOffset is set for the number 5; which is +5 behind of GMT. This also means you must change the Offset according to how many hours your charts are behind; or in front of NY 17:00 Eastern Standard Time. Example: Lets say you are in PST Pacific Standard Time zone and your brokers time on the MT4 is 22:00 GMT at 17:00 EST. That places your chart time +5 hours GMT PLUS the 3 hours behind New York which is +8. So that means you will change the gmtServerOffset - in the Inputs tab, to number 8 in order to get the 17:00 New York time on your charts for ending of the trading day. I believe if you are already in the GMT zone your number will have a minus. So you may know the forex market closes and reopens at 17:00 EST all across the globe for the exchange rate during each day of trading. And it matters not what time zone you are in. In order for this to work on the chart; the label max Timeframe - under the Inputs tab, must be set for the chart in minutes. 1 hour is 60 minutes; 2 hour is 120 minutes. The Daily is not set up with this indicator. The reason I do not have all the sessions showing with -1 is not to clutter the charts visually. But if you want all the sessions showing then change the sessions in 24 hour period and not 12 hours. Such as; Tokyo 19:00: London 03:00: and New York 08:00. 4. Paradox_MACD; the Input for the MACD is the TimeFrame in which the chart is set up for. And again; the TimeFrame are in minutes. The Daily is 1440 minutes.
Common Tab: The DLLs in the Common tab for all the indicators are checked and must remain checked. I suggest very strongly not ever add anything to this system especially indicators or any kind of meters. If you do then you have corrupted the system. This is a proven system and will make you very wealthy or at least a very good living if you leave the system as is. This system will bring your dreams to reality if only you follow the rules. This system is set up to work with any pair in the market. But for all-purposes on this thread, we will be using the USAJPY in answering questions and for trading. I usually trade the EJ but because of its volatility the UJ is a choice for learning. So please for all questions, and posting charts is with the UJ. Any others but the UJ will be disregarded. FYI the candle countdown indicator shuts off at 17:00 ET on Fridays when the market closes; and will show again at 17:00 ET Sundays when the market reopens. And also the Market Price is showing according to your brokers spread. Since this is the week-end; be sure to reboot your MT4 after the market opens on Sunday. I will talk about entries off Resistance in a downtrend; and entries off Support in an uptrend. I recommend highly in using your 2 hour for downtrends and using your 1 hour for uptrends. Because of the volatile market in a down trend the 2 hour is pretty stable with the volatility and is constant. Doesnt mean you cannot use the 1 hour provided you catch the top on a reversal. So with this scenario on a downtrend I will go back to Tuesday at 17:00 EST in an uptrend changing over to a downtrend at 17:00 Wednesday. Pay a close attention in how I use support on an uptrend and resistance on a downtrend.
Now I am going to use snippets representing the moment. This first snippet is the 2 hour chart after opening of the 17:00 candle and what is showing? First we recognize the trend with White Smooth and EMA had crossed Purple for the uptrend with the Parabolic in trend; in which all four are supports. Next we have ROMAR as resistance. The 1 hour: On the same two hour candle we have the same trend: White Smooth and EMA in the uptrend trend with the Parabolic in trend. We also have ROMAR crossing Purple as a signal of changing trend for this swing. You also had the SAR attached to the previous two candles at the upper band. This attachment means a retrace back to support; and the SAR did reattached on the second 1 hour candle. And this is where I took my entry as low as
possible at the Daily Open line at 117.272. Because of taking the entry as low as possible ROMAR was no longer a threat of losing my trade in using B/E. This next 1 hour is showing the market getting above ROMAR which is now support and crossing EMA for the change of trend. And Traders that was an easy 40 pips.
Next Trade: One thing you have to always keep in mind and that is the Daily supports and resistance. On the trade above in the uptrend; the market also hit the Daily EMA resistance. This is why you always have a trading plan right there at your trading station. Showing here: The Daily trend is down but also in consolidation. Both ROMAR and EMA are still in the downtrend. And this trend will not change until EMA crosses Purple and then: Well ROMAR will be one tough wall to break until EMA is within striking distance. So be looking at a lot of up and down days.
On this next trade you have the 2 hour showing the turn back into the downtrend and especially with the hit on the Daily EMA. You have showing a Red Arrow with the market breaking EMA and the Open Candle below Smooth. As support you have ROMAR and the Parabolic.
On the 1 hour you also have the Red Arrow and also the White Arrow for crossing the MACD zero. You have the open candle below Smooth resistance with ROMAR as support and the Parabolic had flip as resistance. My question is: Would I trade in this situation and the answer is not at this time. The risk for retraces is more than I want to chance
But what I will do though is wait on the Parabolic to flip on the 2 hour before I risk any money on a trade. And here is the entry with the Parabolic flip and open at Purple with the EMA crossing. Take note of change of trend with the four horsemen in trend. This is trading in the moment catching the trend at the top; and just letting the market give up the pips: Another 40 pip trade compounding.
Lets look at the retraces with the 1 hour in using the uptrend closing Friday: We have an entry at Purple with the four horsemen in the uptrend; with 40 pips before retrace to Smooth for another entry into the trend.
Next Retrace is EMA for an entry You had the SAR attached with the candle at the Parabolic for another entry to finish the day and week.
That was 3 easy entries in a trend. Imagine what you could have done in this trend; or any trend within the Paradox. If you had taken the first entry at the bottom you could had rode this trend to the top The Power Within: The Paradox System is totally coded and based upon the LR. The linear regression relationship is between two variables by fitting a linear equation to observed data. One variable is considered to be an explanatory variable, and the other is considered to be a dependent variable. This method calculates the observed data by minimizing the sum of the squares of the vertical deviations from each data point to the line (if a point lies on the fitted line exactly, then its vertical deviation is 0). Because the deviations are first squared, then summed, there are no cancellations between positive and negative values. So, in order to deviate the slacking of an indicator this method had been modified as a simple linear regression to eliminate the least squares of a linear regression model with a single explanatory variable. In other words, simple linear regression fits a straight line through the set of n points in such a way that makes the sum of squared residuals of the model that is, vertical distances between the points of the data set (price momentum) and the fitted line as small as possible. Trading with standard indicators is always subjected with Resistances and Supports. When you trade with indicators that are no longer subjective, and have been mathematically lined with a linear regression base, then you eliminate errors-in-variables as a true support and resistance within the indicators. This approach gives the most important application with this system which is in data fitting.
This also means at the end of the day (17:00 EST) you have to reload the data if not; then the data is not correct for the next day of trading. Trading Objectively vs Subjectively: "Whoever trusts in his own mind is a fool, but he who walks in wisdom will be delivered." Objective: A: based on facts rather than feelings or opinions: not influenced by feelings. B: expressing or dealing with facts or conditions as perceived without distortion by personal feelings, prejudices, or interpretations. C: limited to choices of fixed alternatives and reducing subjective factors to a minimum. Subjective: A: of, relating to, or characteristic of one that is a subject especially in lack of freedom of action or in submissiveness. B: characteristic of or belonging to reality as perceived rather than as independent of mind. C: arising out of or identified by means of one's perception of one's own states and processes. D: lacking in reality or substance. There is a fine line between the both. Being objective is taking something that "is" and turning which "is" into what defines truth (which is facts). And your reasoning is in the way you think. You cannot take what "is" into anything else, because what "is" belongs to facts. And if you stay within the truth of facts then you are being objective and new doors are being open into a realm of a new thought process you had not experience in the past. Being objective is also being totally opened minded with what "IS". If you are not open minded then what "IF" becomes a delusion. Being bias means you are subjective. Being bias defines the difference between a winner and a loser. The biasness of ones mentality is also the conqueror of ones destruction leaving nothing in their wake. This is the main reason traders blows accounts after accounts and it
makes no difference if you are Bull or a Bear. Being bias is planting a seed that will harvest and eventually be a destructive force in your trading. It is the same with fear; fear is an acronym for False Evidence Appearing Real. Understand this - fear is a lie. It plays on your emotions in taking control of your instincts without gaining knowledge. Biasness and fear is the control of your thinking. When you start to think in terms of trading - then you are walking in deep water which is holding you back. Using your intellect in trading this system is far weaker than the Paradox Trend. It is only through wisdom can you use the power within the Paradox Trend. Knowledge is gaining Wisdom. It is the very solution to overriding the context of any element, and letting your instincts flowing free in gaining knowledge through understanding. Then there is your ego: With the mixture of biasness, fear, mixed with ego you then have the elements of destruction. It is your ego keeping you from gaining the 3 elements of success (understanding, knowledge, and wisdom). The bottom line: Biasness, Fear, and Ego are the reason why all traders fail. Those 3 elements is the very control of living your life in nothingness. The Power of Confluence: What is confluence and why is it so important when trading the Forex market? It is important because you can integrate it into your current trading strategy to help put the odds in your favor. What is Confluence? Essentially confluence represents two or more things coming together at the same time. In terms of trading, we can say that confluence is when two or more factors come together at the same place on a chart or two different charts. Examples of these things might be a key support or resistance level, moving average, price behavior with buy or sell signal or even something as simple as a strong trend. All of these things form what we will call Confluence Factors. In other words a strong trend might be one factor; support or resistance might be a second factor and so on. Putting the Odds in Your Favor
I think I can be so bold as to say that consistent profits are the goal of every serious trader. So why then do only a small portion of traders make it to this level? It all comes down to the use of confluence. Those traders who can be called consistently profitable have found a way to identify and harness the power of confluence in a way that puts the odds in their favor. The ability to put the odds in your favor is what trading is all about. Figure out a way to do this over and over again and you'll be well on your way to becoming profitable. This is where the combination of various Confluence Factors comes into play. In other words; the more Confluence Factors present on any given setup, the greater the odds are that the setup will move in the intended direction. Putting the Power of Confluence to Work We all know that trading with the trend, or path of least resistance, is always a good idea. At the risk of sounding cliche', the old saying, "the trend is your friend" is absolutely true in my experience. Even in consolidation placing the Confluence Factor into place is very profitable. How The Paradox Will Boost Your Forex Profits: Perhaps you remember one of the most impact movies of our time, the Matrix? Morpheus believed totally in Neo to the point where he almost sacrificed his life to save him. Yet Neo did not believe in himself at the beginning, he was most uncertain about whether he was the one or not. So when he went to see the Oracle, she told him that being the one is like being in love, nobody tells you that you are in love, you just know it. The Oracle pointed to a sign hanging on the door: "Know Thyself". Still Neo didn't believe in himself but when agent Smith captured Morpheus and a member of his crew suggested pulling the plug so the agents of the Matrix won't get access to Zion, something in Neo changed and he began to believe. A little further down the path of the one, Neo "accomplished miracles" because he learned how to believe in himself fully and completely. And remember Neo had a mentor who believed in him beyond any doubt and who taught him how to use his mind to defeat the Matrix and its dangerous agents. Neo's mentor, Morpheus, showed him the path and helped him empower his mind, yet Neo walked the path to his own success after he started believing in himself and mastered his own mind. Perhaps you were wondering what has this to do with trading the Forex? "Know Thyself"
Forex trading, or any trading for that matter, is a mind game in the first place. Some people spend a lot of time and efforts perfecting certain trading skills and knowledge like reading the charts and data, entry and exit skills, but any normal intelligent person can learn these skills; they are the easiest part of the trading game. They are no doubt necessary tools for your success but they don't make the biggest difference between a really successful trader and the one who is not successful. So what does make the difference? Let's ask the question: what is your goal in trading the Forex? It is to make money. Period! Surely, while you're making the money and great profits you can have fun too and you should. But what you really need are specific mental attitudes and strengths to become a successful trader. These mental states are an asset that will help you in many other situations and contexts of your life. The major three mental and emotional frames of mind that characterize the majority of successful traders are: 1. Discipline & Passion 2. Confidence & Courage 3. Patience & Smart Persistence We'll touch upon all three briefly to make it as clear as crystal to you so you succeed in the Forex market. Like trading a Pair of Currencies these mental and emotional mindsets go hand in hand. Discipline & Passion - Discipline is really important! It helps you be more effective in planning your trades and in sticking to the good plans you established before entering the trade. Always have an action plan for stop and limit levels for the trade before you enter it, your analysis of the charts should cover up the expected upside and downside. Passion means commitment and love for what you do. It is your passion for something that keeps you going, improving, constantly learning (remember Morpheus mentoring Neo) and persist beyond the ups and downs of the business. You need to know why you are trading because it is an awesome opportunity that you have to take, so develop a passion for it. Simply do what it takes to be successful and learn from the best. Do not make trading a hobby. Treat it as business. A word of Caution: Never mistake your "passion" for emotion that you might feel while trading and trying to enter a trade without using clear and sound entry/exit indicators and rules. Have fun, learn, and stay tuned for future developments and grow as a person in
strength and character while remaining emotionally detached when you get in and out of a trade. If you do, you are bound to incredible success in your trading. Confidence & Courage - Successful traders believe in themselves and their abilities to learn and grow, to acquire more competence learning from a mentor. There is no reality only perception, the Matrix can trick you but you can have your own special Matrix inside your mind that empowers you with an unwavering belief in yourself! Have the confidence and courage to stick to your plan and stay within rules or trading even if others are doing the opposite. Keep your vision (end result) that you can make it in the market in your mind until you are successful in it. If you experience a situation where you know exactly how a currency pair will go and have a sound trading plan then go for it! Sometimes people fail to follow their own good plans because all sorts of emotions get in their way, emotions like greed and fear. Stay calm and act with confidence and courage otherwise your planning, analyzing and information gathering will be totally useless to you. You become more competent when you educate yourself about the markets and learn from successful traders. Self-develop: "Know Thyself", get into the habit of monitoring your emotions and questioning your limiting beliefs so that your mind works for you and not against you. Don't take things too personally, if you make a mistake then consider it to be valuable feedback so you become more successful, never a failure! Patience & Smart Persistence - An Indian wisdom says: "Life is always right!" we say: "the market knows much better than you do!" Learn to listen and read the signs the indicators are giving you. Learn how to wait, observe and only enter a trade when it is the right time to do so and do not hesitate. Hesitation is a failure of becoming successful. It can be hard to wait before your charts jumps into action. But a successful trader will enter a trade according to the direction of the prevailing trend or will wait until a new trend shows up and establishes itself. Even if you day trade and are not a long-term or position trader, you still are well advised within the indicators from ruining your profit chances. Also be patient means you stick with winning trades. Practice "Know Thyself"; and you will be on the path of Neo, the one himself!
Here is a picture for end of day Friday with the name of the Indicators: Each indicator is both support and resistance. The Purple, White, and Smooth are the 3 leaders in reversing trends. ROMAR is the Primary trend indicator. EMA is the Secondary trend indicator. And the Parabolics sets the trend. On a reversal White is your first indication of a reversal by crossing Purple; then follows Smooth. Smooth is a great indicator for you letting you know if the trend will reverse. If Smooth crosses Purple then you have a beginning reversal. If Smooth slides under Purple on an uptrend; or above Purple on a downtrend; you have what is called a slider and will continue in the trend and not reverse. EMA will also stay in the slider for the continuance of the trend. But if Smooth crosses Purple then EMA will cross Purple and the reversal is set provided the Parabolic had also flipped. Now this picture above is from the 1 hour chart and lets says a reversal is in the makings and the Parabolic had flipped. This only means the 1 hour chart is set up for the reversal but
does not mean the 2 hour is also set up for the same reversal. So you must check your 2 hour for the Parabolic flip. If it has not then you must wait on the 2 hour Parabolic. Otherwise you will have continuance retraces on the 1 hour until the Parabolic on the 2 hour had flipped. This is known as Confluence Factors. ROMAR is your leading trend indicator for the market. In this picture you see ROMAR as the leading trend for the up. The reversal for ROMAR is with crossing EMA. Do not ever anticipate these crossings. If you do you could possibly be running into a SLIDER