Download
1 / 29
290 likes | 740 Vues
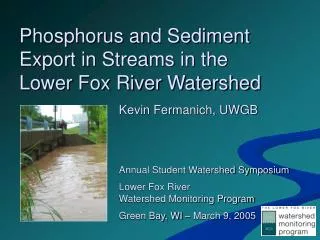
Lower Fox River Suspended Sediment and Phosphorus Load Allocations and Reduction Strategies to Green Bay using the Soil and Water Assessment Tool (SWAT). Fox-Wolf Watershed Alliance Research Symposium November 8, 2007 Lawrence University Appleton, Wisconsin. Paul Baumgart and Kevin Fermanich

E N D
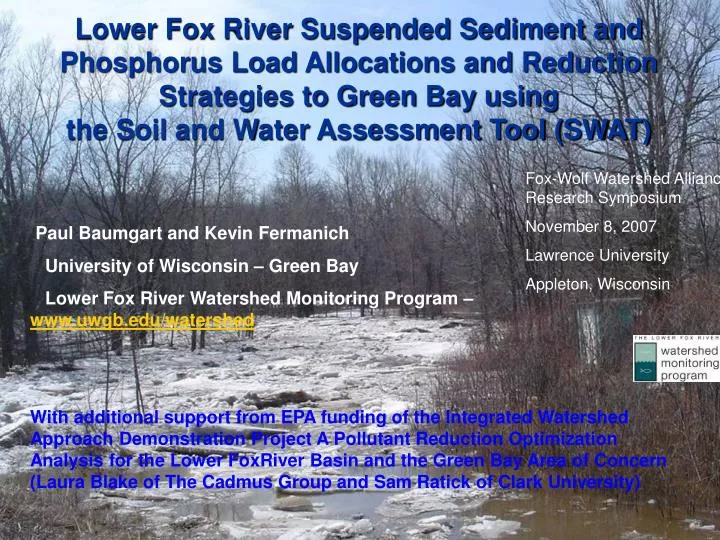
Lower Fox River Suspended Sediment and Phosphorus Load Allocations and Reduction Strategies to Green Bay usingthe Soil and Water Assessment Tool (SWAT) Fox-Wolf Watershed Alliance Research Symposium November 8, 2007 Lawrence University Appleton, Wisconsin Paul Baumgart and Kevin Fermanich University of Wisconsin – Green Bay Lower Fox River Watershed Monitoring Program – www.uwgb.edu/watershed With additional support from EPA funding of the Integrated Watershed Approach Demonstration Project A Pollutant Reduction Optimization Analysis for the Lower FoxRiver Basin and the Green Bay Area of Concern (Laura Blake of The Cadmus Group and Sam Ratick of Clark University) Full report: www.uwgb.edu/watershed/reports/LFox_Load-Allocation.pdf
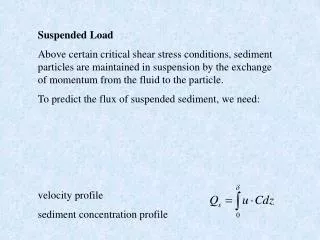
Primary objective Utilize watershed simulations to support watershed TMDL load allocations and predict impact of sediment and phosphorus reduction strategies within Lower Fox River Sub-basin (1580 km2)
Watershed background: Soil Permeability • Clay soils • High % runoff • 730 mm precip avg • ~ 200-240 mm flow • ~ 16-27% baseflow
Lower Fox River watersheds & subwatershedsLFRWMPValidation Sites
Soil and Water Assessment Tool - SWAT • USDA – ARS model: J.G. Arnold, J.R. Williams, Temple Texas • Continuous daily time step, river basin/watershed scale model ------- physically based • Routes water, sediment, nutrients and pesticides to watershed and basin outlets • Predict impacts of management on water, sediment and chemical yields • Long-term simulations of many decades • Tracks crop growth, tillage, fertilizer/manure application, nutrient cycling on a daily basis • Conservation Effects Assessment Project Tool (CEAP) • Applied modified version of SWAT 2000 code • GIS > spreadsheet > SWAT 2000: to allow more flexible/complex management files
Modeled Simulations • 1977-2000 climatic period • “2004” landuse Baseline conditions • Alternative management scenarios • 2004 landuse conditions with modifications
Model Inputs – GIS layers • Landuse – land cover • WDNR Wiscland land cover - 1992 • Brown County, ECWRPC – 2000 to 2001 • Trends: above plus USGS 1:24k topographic maps • Soils – County SSURGO • sub-watershed area-weighted averages • 4 soil layers • AWC, bulk density, sat. cond, K, hydro-group, etc • Slope – 30 m Digital Elevation Model • Watershed boundaries - WDNR, USGS, BLRPC • WNDR Stream hydrology 1:24k, Brown County Buffers • ARC-INFO, ARCVIEW, Spatial Analyst (ESRI) • Climate: 1976-2000 daily Green Bay NWS, Appleton, Brillion, 3 long-term stations • Plus 15 UWGB & USGS tipping buckets & loggers • Point source loads from WDNR
Model Calibration & Assessment • Calibrate: 1) flow 2) crop yields and nutrient levels 3) suspended sediment 4) phosphorus 5) diss. P • Validate/assess: flow, SS, P at different time and/or site • Daily, event, monthly, annual, total basis • Primary Calibration site: USGS/WDNR - Upper Bower Cr. (36 km2) • Primary Validation sites (Lower Fox River Watershed Monitoring Program Watersheds --- plus USGS, GBMSD, Oneida Nation funding): Apple Creek at Campground - 117 km2 Ashwaubenon Creek at Creamery Rd. - 48 km2 Baird Creek at Superior - 54 km2 Duck Creek at FF - 276 km2 East River at Monroe St. – 374 km2
Calibrate – Validate: Stream FlowUpper Bower Creek events Untransformed: R2 = 0.80, NSE = 0.80 Untransformed: R2 = 0.95, NSE = 0.94 for n = 12, not ice-affected events
CalibrateMonthlyStream flowUpper Bower Creek R2=.87, NS=0.86 ValidateMonthlyStream flowUpper Bower Creek R2=0.76, NS=0.76
Calibrate – Validate: Suspended SedimentUpper Bower Creek events Untransformed: R2 = 0.96, NSE = 0.95 Untransformed: R2 = 0.85, NSE = 0.85
Assessment/Validation Summary: unadjusted model applied to LFRWMP watersheds (2004-05 data) Initially 2006 data not utilized because not finalized at time (Nov 06 to April 07) Validation criteria objective: R2 or NSCE of 0.6 or greater (with some qualifications)
Assessment/Validation Summary:adjusted* Duck Cr. & East River (2004-05) * Duck Creek: P sorption coefficient and P partitioning coef. * East River: sediment transport factor (800 mg/L to 500 mg/L)
Assessment/Validation Summary:adjusted* Duck Cr. & East River (2004-06) * Duck Creek: P absorption coefficient and P partitioning coef. * East River: sediment transport factor (800 mg/L to 500 mg/L) When 2006 data added, model did not perform as well, which reduced statistical measures
Model Assessment Summary • In general, a fairly good correspondence between simulated and observed stream flow and loads of phosphorus and suspended sediment (monthly, annual, totals) • Model response acceptable for predictive simulations in sub-basin • Model least able to predict flow and loads: • from small events, affected phosphorus loads most • after prolonged dry periods • during snow melt periods • from East River at this time (sediment loads)
Model Results – Baseline Conditions • Stream flow and loads at sub-basin, watershed and sub-watershed scales • Total, and by HRU/landuse category
Simulated P Load to Lower Green Bay from LFR Basin:2004 Baseline vs. Opt. Scenario of Ag BMPs and Point Source Reductions (note: Winn load ~ 288,000 kg/yr) From: Integrated Watershed Approach Demonstration Project A Pollutant Reduction Optimization Analysis for the Lower Fox River Basin and the Green Bay Area of Concern (Table 6). Prepared by Laura Blake of The Cadmus Group for U.S. EPA (with contributions by P. Baumgart of UW-Green Bay and Sam Ratick of Clark University)
Simulated impacts and cost of Optimal Scenario on phosphorus non-pt source loads to Green Bay from LFR subbasin. Optimized for P reduction. From: Integrated Watershed Approach Demonstration Project A Pollutant Reduction Optimization Analysis for the Lower Fox River Basin and the Green Bay Area of Concern (Table 6). Prepared by Laura Blake of The Cadmus Group for U.S. EPA (with contributions by P. Baumgart of UW-Green Bay and Sam Ratick of Clark University)
Simulated impacts and cost of Optimal Scenario on sediment and phosphorus non-point source loads to Green Bay from LFR subbasin. Optimized for P reduction. From: Integrated Watershed Approach Demonstration Project A Pollutant Reduction Optimization Analysis for the Lower Fox River Basin and the Green Bay Area of Concern (Table 6). Prepared by Laura Blake of The Cadmus Group for U.S. EPA (with contributions by P. Baumgart of UW-Green Bay and Sam Ratick of Clark University)
Next Steps • Refine SWAT stream bank erosion estimates - Sediment source tracing with radionuclides
Sediment Tracer Preliminary Investigation • Objective: determine relative contributions of suspended sediment sources to streams in Lower Fox watersheds • Sources: rural runoff, stream bank, construction site, urban • UW-Milwaukee (Val Klump) radionuclide analysis (Cs-137, Pb-210, Be-7) • UW-Green Bay sampling & processing & other chemical analysis (GBMSD and/or UWGB) • 66 samples collected/analyzed from 2006 to Oct. 2007 • Suspended sediment (streams – 9 samples) including Spring snowmelt samples from Baird North & South branches • Soils (surface, top, bottom for total of 36) • Sub-soil (3 samples) • Stream bank (6 samples - Baird Creek) • Huron-Sitka Detention pond (2 cores, 12 samples) • Lab results from UW-Milw. done, but not fully analyzed yet
Sediment Tracer Preliminary Investigation Time-integrated suspended sediment sampler
Sediment Tracer Preliminary Investigation:Only very preliminary results at this time
Acknowledgements • Dave Graczyk, Paul Reneau, Dale Robertson and Troy Rutter -- U.S. Geological Survey • John Kennedy and Tracy Valenta, GBMSD • Oneida Nation • Outagamie LCD (Sue McBurney, Jim Poweleit, Ann Francart • Laura Ward Good (UW-Madison) • Bud Harris, Dave Dolan -- UWGB • Jesse Baumann, Jessie Fink, Jon Habeck, Nick Reckinger, Erika Sisal, Zach Zachariah -- UWGB • Arjo Wiggins Appleton, Inc. Special thanks to the following people for their assistance with this project:
Questions? Email: baumgarp@uwgb.edu Full reports: www.uwgb.edu/watershed