Download
1 / 24
240 likes | 882 Vues
Supply, Demand, and the Price of Real Estate Assets ... Long run the supply curve of real estate is influenced by cost of construction ...

E N D
Chapter 2 Investment Strategy and the Concept of Market Efficiency
Supply, Demand, and the Price of Real Estate Assets • Demand • Relationship between market price and the quantity of a good or service that will be bought per time period, over the entire range of possible prices • For real estate assets, demand is inversely related to their price
Supply, Demand, and the Price of Real Estate Assets • Demand Schedule is the relationship between price and quantity; demand curve is the graphic form of the same information • A specific demand schedule applies only to a defined population vying for a particular class of property
Supply, Demand, and the Price of Real Estate Assets • Shift in demand—the entire range of relationships between price and quantity demanded changes. Among determinants of location and shape of demand curves for real estate assets, and of changes in demand are: • Number of prospective tenants • Changes in operating expenses • Yields available on other assets • Technology • Tastes
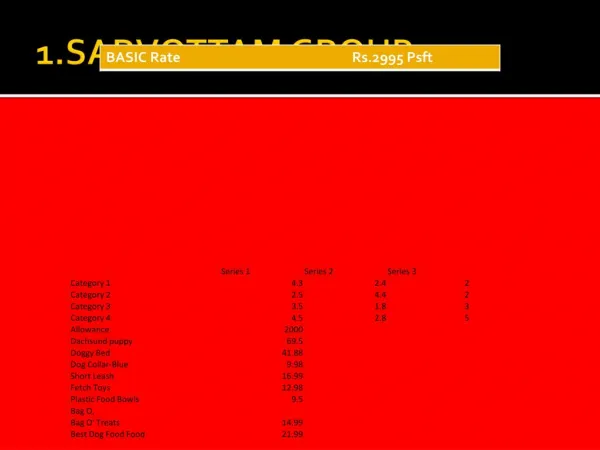
Supply, Demand, and the Price of Real Estate Assets • Example - demand schedule for downtown office space • Price changes alter quantity demanded • Decline in after-tax cash flow • Market areas become relatively more desirable, drop bidding for downtown property • Less downtown space purchased at each possible price per square foot
Supply, Demand, and the Price of Real Estate Assets • Relative Scarcity • Property in abundance commands no substantial value • Supply is defined as the relationship between price and the quantity of a product suppliers place on the market during a specified time period, for all possible prices
Supply, Demand, and the Price of Real Estate Assets • Supply function differs as specified time period is lengthened or shortened • Short run—variations in the supply of real estate placed on the market are an individuals’ perceptions of the relationship between market value and investment value • Long run—the supply curve of real estate is influenced by cost of construction
Supply, Demand, and the Price of Real Estate Assets • Quantity supplied —refers to amount of product that will be placed on the market per period of time at a specified price • Supply —the relationship between price and quantity supplied over the entire range of possible prices
Supply, Demand, and the Price of Real Estate Assets • Equilibrium price –price at which there will be sufficient quantity of a product to satisfy desires of all consumers at that price, but with no surplus remaining on the market. Quantity demanded and quantity supplied meet at the point where the supply and demand functions intersect.
Market Efficiency and Profit Opportunities • Markets –institutional arrangements or mechanisms whereby buyers and sellers are brought into contact with each other. There are not necessarily physical entities or geographical location
Market Efficiency and Profit Opportunities • Markets—commonality of product • Owner-occupant market • Renter-occupant market • Multifamily investment • Nonresidential market
Market Efficiency and Profit Opportunities • Range of Markets • In an atomistic market, each participant is so insignificant relative to the size of the total market that he has no perceptible effect on price, Every buyer can purchase as much as desired, every seller can sell as much as desired. • In an absolute monopoly, there is only one supplier or a good or service for which there are not reasonably acceptable substitutes
Market Efficiency and Profit Opportunities • Price Searchers and Market Efficiency • In an efficient market, information is transmitted quickly and without cost, eliminating above average profit • Time required for information to be reflected in price is a measure of market efficiency • In less efficient market, information is scarce and costly; greater degree of price searching
Market Efficiency and Profit Opportunities • Sources of Market Inefficiency • Information costly and difficult to obtain; comparison shopping expensive and time consuming • High transaction costs prohibit portfolio adjustment • No two properties exactly alike
Strategy Implications • In atomistic markets, economic rent will be rare and short-lived • Less efficient the market, longer the adjustment process takes