Download
1 / 24
250 likes | 428 Vues
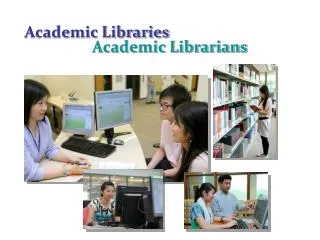
Analyzing Relationships Between School Libraries and Academic Achievement. Keith Curry Lance Director Library Research Service Colorado State Library & University of Denver. Outline. Background Research questions Data types & sources Statistical concepts & techniques “Success stories”.

E N D
Analyzing Relationships Between School Libraries and Academic Achievement Keith Curry Lance Director Library Research Service Colorado State Library & University of Denver
Outline • Background • Research questions • Data types & sources • Statistical concepts & techniques • “Success stories”
Background • A half century of previous school library research • The political climate of education & libraries in the late ’80’s • The School Match Incident • The first Colorado study • The political climate of education & libraries in the late ’90’s • The second Colorado study & successor studies by Lance, Rodney & Hamilton-Pennell • Successor studies by others
Are students more likely to “pass” tests if they have a school library than if they don’t? Are students likely to score higher on tests if they have a school library than if they don’t? As the school library improves, do test scores rise? How are different qualities of school libraries, schools, and communities related to each other? Do school libraries & test scores improve together, even when other school & community conditions are taken into account? Research Questions
Nominal Categories No necessary quantitative dimension Pass/fail, library/no library Ordinal Degrees of difference No equal intervals Zero is just a code Usually limited number of values Interval/Ratio Equal intervals True zero (have none of something) Usually large number of values Weekly hours of librarian staffing, test scores Types of Data
Dependent variable “The effect” in a cause-and-effect relationship Reading test scores used to “operationalize” concept of academic achievement Independent variables “The causes” in a cause-and-effect relationship Characteristics of school libraries, schools & communities “Treatment” or predictor variables “Control” variables Types of Variables
State Test Scores • Standards-based tests v. “standardized” tests • Test scores, % proficient & above v. % “passed” v. percentile rankings • Reading scores are key • Difference between existing & available data (actually acquiring data file in a usable format & on a timely schedule)
The Data Model Community School library School Test scores
Experiment Older studies Smaller samples More precise units of analysis (student) More control over independent variables Matching issues Easier to explain, communicate Statistical analysis Newer studies Larger samples Less precise units of analysis (school) Less control over independent variables Data availability issues More precise measurement of effects Experiment v. Statistical Analysis
Statistical Significance • Likelihood the sample results are representative of the universe under study • Most common notation: • p < .05, < .01, < .001 • Difference between statistical significance & confidence interval (i.e., margin of error) • No statistical test of SUBSTANTIVE significance (i.e., how important is this?)
Statistical Analysis Software • Market leaders: • SPSS: Statistical Package for the Social Sciences • SAS: Statistical Analysis Software • Software Issues: • Available statistical techniques: correlation, comparison of means, factor analysis, regression • Data management features: sort, sample, compute, recode, if • Case limits(maximum number of cases allowed) • Cost(education discount)
Cross-tabulation • Are students more likely to pass tests if they have a school library than if they don’t? • Two nominal variables or one nominal and one ordinal (small range) • Pass/fail on tests, librarian/no librarian • Turning interval or ratio variables into nominal or ordinal ones • Chi-square (X2) indicates statistical significance
Test Scores by Time Spent Teaching Information Literacy: Alaska, 1998 Chi-square = 12.743, p < .001
Comparison of Means • Are students likely to score higher on tests if they have a school library than if they don’t? • One nominal (2 dimensions), one interval or ratio variable • Pass/fail on test, hours of librarian staffing • Generates means (averages) for 2 groups • Levene’s test indicates equality (or inequality) of variances between groups • t test indicates statistical significance of difference between groups
Student Visits for Information Literacy Instruction for Higher & Lower Scoring Elementary Schools: Alaska, 1998 t = 3.963, p < .001
Correlation (r) • As the school library improves, do test scores rise? • Two interval or ratio variables • LM expenditures per student, volumes per student • Pearson’s product-moment correlation (r) • Expressed in decimal form • Perfect correlation = 1.00 • + & - indicate positive & negative relationships (+ = both rise or fall, - = one rises, other falls) • r = .60-.80 v. .80+ & factor analysis • r square = percent of variation explained
Bivariate Correlation Coefficients for LM Program Development Variables: Colorado Middle Schools, 1999 p < .001
Factor Analysis • How are different qualities of school libraries (schools, communities) related to each other? • Analyzes relationships between and among variables • Key statistics: • Percent of variance explained • Factor loadings • Factor scores • Allow mixing items on different scales • Data reduction technique
Factor Analysis of LM Program Development Variables: Colorado Middle Schools, 1999 Initial eigenvalue = 4.638, 77% variance explained
Regression (R, R2) • Do school libraries & test scores improve together, even when other conditions are taken into account? • Need to conduct correlation—and often factor—analyses first • Linear regression • Stepwise regression • Multiple R, R square & R square change • Standardized beta coefficients (indicate positive or negative direction) • Included v. excluded variables
Regression Analysis of 4th Grade Scores with LM, School, & Community Predictors: Colorado, 1999 p < .01 Excluded variables: teacher-pupil ratio, per pupil expenditures, teacher characteristics
“Success Stories” • Even the strongest statistical evidence can be made more persuasive by compelling “success stories”
Characteristics of Good “Success Stories” • One clear point: value of librarian as teacher (technology coordinator, in-service provider) • Variety of voices: librarians, students, teachers, principals, parents • “Short & sweet” • A quotable quote