Download
1 / 25
370 likes | 1.14k Vues
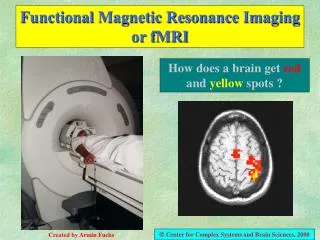
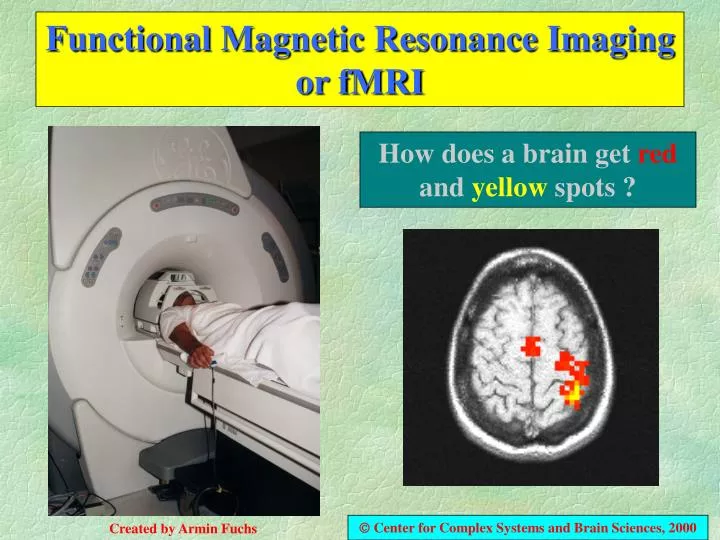
Functional Magnetic Resonance Imaging or fMRI. How does a brain get red and yellow spots ? . Center for Complex Systems and Brain Sciences, 2000. Created by Armin Fuchs. fMRI – What is does.

E N D
Functional Magnetic Resonance Imaging or fMRI How does a brain getredand yellowspots ? Center for Complex Systems and Brain Sciences, 2000 Created by Armin Fuchs
fMRI – What is does fMRI is a modern noninvasive imaging technology which can be used to identify regions in the brain that get activated when participants perform certain tasks. In contrast to conventional MRI scans showing brain structure, fMRI provides information about brain function.
fMRI – How it works In a nutshell: The oxygen carrier in blood is the hemoglobin molecule. When this molecule releases oxygen to a cell its magnetic properties change from a so-called diamagnetic to a paramagnetic state. This difference can be found in image series taken by the scanner. With the assumption that in activated regions more oxygen is released compared to inactive regions, blood serves as a natural contrast agent for detecting brain activity.
So we detect the deoxygenated hemoglobin ? Well, not exactly. Because the blood flow in the brain overcompensates the actual need of oxygen,there is more oxygenated hemoglobin inside the active regions than can be used. So what we detect is the unused blood or the oxygenated hemoglobin. This is known as the Blood Oxygen Level Dependent or BOLD contrast.
MRI scanners can collect a variety of different images depending on the scan sequence like the ones below: How do we do that ? T1 weighted images Proton density images T2 weighted images
Inversion recovery images Echo planar images
T1 weighted images are used to obtain brain structure for reconstructions of the cortical surface or as overlay images for for functional activity. They show fluid in dark and the brain ‘right’, i.e. white matter bright and gray matter gray. • T2 weighted images are used in most medical scans. Fluid appears bright and gray matter is brighter than white matter. • Inversion recovery scans allow for suppressing tissue with certain properties and for optimal control of the contrast. • Echo planar images certainly don’t have the same resolution as the other scans. In fact, they look pretty bad, but they can be taken extremely fast and make functional imaging possible.
Typical Scanning Times The time a scan takes depends on many things like resolution, intended signal to noise ratio and more. The following times are for standard sequences we typically use. T1 weighted full head scan (120 slices, 256x256 pixel per slice with a voxel size of 1x1x2mm3) takes about 10min. T2 weighted and inversion recovery scans are comparable. The echo planar sequence we typically use takes 20 slices with 64x64 pixels and a voxel size of 3.5x3.5x7.5mm3 IN 3 (THREE) SECONDS !!!
O.K., but what do we see on them ? By just looking at them not much. Below are two sets of echo planar images taken while the subject was moving a finger (top) and during rest (bottom).
So how does it work then? Well, every three secondswe collect a volumeof 20 or so slices and we tell our participant in the scanner to keep her eyes closed and just rest. We then scan for 30sec which gives us ten volumes of the brain as a base line. Now we tell our subject to perform a task, say move your right index finger back and forth, and we keep her doing that for another 30sec or ten volumes. Then we tell her to rest again. This pair of rest and task 30sec each we call a block. The participant will perform four blocks of task and rest lasting four minutes during which we scan the volume 80 times or collect 1600 slices.
Now we have a 4-dimensional dataset which three spatial dimensions (the volumes) and one dimension in time. Each volume consists of 20 slices consisting of 64x64 pixels (for ‘picture elements’) or 20x64x64=81920 little volumes of 3.5x3.5x7.5mm3 each called voxels (for ‘volume elements’). We have taken 80 of these volumes and now we look at how the activity in individual voxels changes as a function of time, i.e. whether they are related to the periods of rest and task the subject performed during the scan. A typical example of time series of voxels from a single slice looks like this :
What did I see in this picture ? On the left you see the time series corresponding to the the voxels inside the green box on the slice in the middle right. Obviously, certain voxels follow the task function, i.e. off-on-off-on … plotted in red above the time series in the middle. This function is delayed by about 6sec to account for the time it takes the hemo-dynamic system to respond. The bottom right blow-up of one voxel shows that this curve and the intensity recorded from the voxel match quite well. Now the correlation between the task function and the time series from all 81920 voxels are calculated. If the correlation is less than 0.5 it is ignored. If the value is greater than 0.5 the voxel gets a color corresponding to the intensity between its min and max.
Why didn’t we see this earlier? There was no difference ! Actually, there was. It’s just that the difference between the task and the rest is very small compared to the baseline (only a few %) so we couldn’t see it. After subtracting this baseline the differences are quite striking. Certain locations in the brain (the active voxels) follow the task-rest cycles, others are completely unaffected. Calculating the correlation between the task function and the voxel time series is one way to have a computer find active regions (another method is to compare the distributions during the task and rest periods by a t-test to find the voxels where the difference is significant).
Now what about these color spots? Of course, the images don’t come out of the scanner with these colors. They are marks of regions where the computer found high correlations and represent the difference between the average intensity in the task condition compared to rest. In a last step the low-resolution echo planar image is replaced by a T1 weighted image (while keeping the color spots) which is a much better representation on the underlaying anatomy. Here we see a finger movement task which involves motor cortex (on the left) and a region called supplementary motor area (or SMA) in the middle.
And that’s it ??? Essentially, yes. Now we just have to study the activity related to different tasks and find the active regions inside the brain. We show a few simple examples of what can be done with this technology.
Right, left and bimanual The next slide is an example for finger sequencing. In the top row the task is performed with the right hand, in the middle row with the left hand and in the bottom row bimanually. Top, the activity over sensory-motor areas is strongest on the right-hand side of the image (which is actually the left side of the brain, the way radiologists like to have their images because when they look at their patients they see the left side on the right and vice versa). In the middle row the activity is strongest on the left (the right hemisphere of the brain), and on the bottom the activation is approximately the same in both hemispheres.
right left both
Motor versus Sensory The brain regions where movement is controlled for a certain limb are very close to those which get the sensory inputs from that limb (and there are probably good reasons for that). They are, however, on different sides on the central sulcus. The next slide shows in the right column the activity from a finger movement, in the middle a sensory stimulation of the same finger (simply by rubbing), and on the right moving this finger against an obstacle. It is evident that in the first case the activity is more anterior (towards the nose), in the second case it is more posterior (further back), and the third row shows simply both, i.e. motor and sensory activity.
movement sensory both
Syncopate and Synchronize Brain activity not only depends on the task itself but also on the context in which this task is executed. The task in next slide was press a small air pillows held between the thumb and index fingers of both hands at a rate of 1.33Hz paced by an auditory metronome. In the top row the instruction was to press the pillow on the beat, i.e. to synchronize with the metronome. For the middle row the task was to execute the movement in the middle between two consecutive beats, i.e. to syncopate. The metronome was the noise made by the scanner where we recorded four slices every three second leading to pings at 1.33Hz. The bottom row shows the relation between the metronome beats (red bars) and the average movements (black lines), measured as pressure changes in the pillows for both hands and task conditions.
Syncopate Synchronize
Syncopate and Synchronize The slices are taken in the coronal plane because we were mainly interested in activation in the cerebellum, a structure known to be involved in timing tasks. It is know that syncopation is a more difficult task then synchronization. In fact, if subjects are asked to syncopate at higher movement rate (like 2.5Hz) they are unable to to that whereas synchronization at this frequency is no problem. We see the difference in task difficulty in the cerebelar activity which is much higher during syncopation than synchronization. Finally a little movie
Right Hand Figure Sequencing Task • Subject continually touched thumb to the finger of the right hand in the sequence 4235 during the “on” period. • This movie shows the comparison of on and off period of the functional scans rendered with a whole head volume of the same subject. • Note the bilateral activation of the pre-central region (area M1) which is strongest in the contralateral hemisphere. • Also note the strong activation in SMA and the ipsilateral cerebellum.
Armin Fuchs Center for Complex Systems & Brain Sciences That’s it, thanks for watching.