Download
1 / 1
10 likes | 490 Vues
A07-2DP. Analysis of Arctic temperature and moisture advection in recent decades using a self-organizing map technique (SOMs). Natasa Skific 1 and Jennifer A. Francis 2 1 Dept. of Atmospheric Sciences, 2 Dept. of Marine and Coastal Sciences, Rutgers University, New Brunswick, New Jersey, USA

E N D
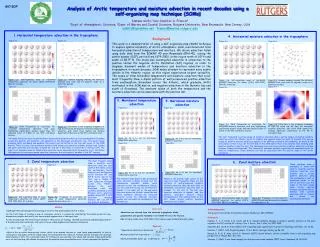
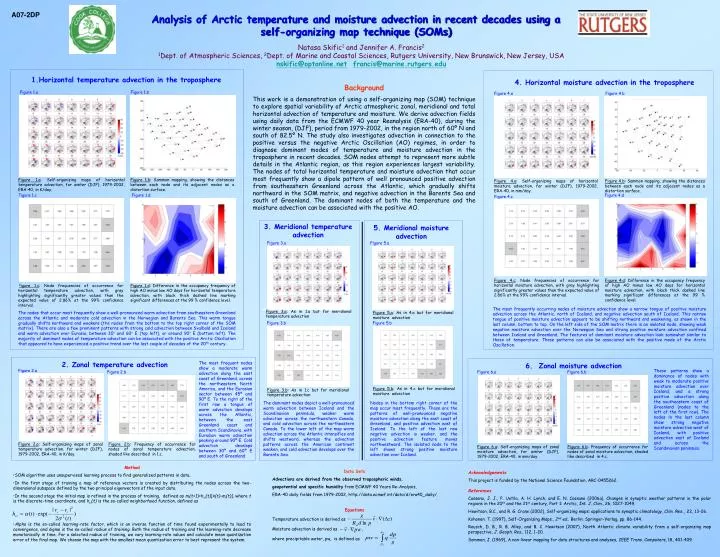
A07-2DP Analysis of Arctic temperature and moisture advection in recent decades using a self-organizing map technique (SOMs) Natasa Skific1 and Jennifer A. Francis21Dept. of Atmospheric Sciences, 2Dept. of Marine and Coastal Sciences, Rutgers University, New Brunswick, New Jersey, USA nskific@optonline.netfrancis@marine.rutgers.edu 1.Horizontal temperature advection in the troposphere 4. Horizontal moisture advection in the troposphere Background This work is a demonstration of using a self-organizing map (SOM) technique to explore spatial variability of Arctic atmospheric zonal, meridional and total horizontal advection of temperature and moisture. We derive advection fields using daily data from the ECMWF 40 year Reanalysis (ERA-40), during the winter season, (DJF), period from 1979-2002, in the region north of 60º N and south of 82.5º N. The study also investigates advection in connection to the positive versus the negative Arctic Oscillation (AO) regimes, in order to diagnose dominant modes of temperature and moisture advection in the troposphere in recent decades. SOM nodes attempt to represent more subtle details in the Atlantic region, as this region experiences largest variability. The nodes of total horizontal temperature and moisture advection that occur most frequently show a dipole pattern of well pronounced positive advection from southeastern Greenland across the Atlantic, which gradually shifts northward in the SOM matrix, and negative advection in the Barents Sea and south of Greenland. The dominant nodes of both the temperature and the moisture advection can be associated with the positive AO. Figure 1.a Figure 1.b Figure 4.a Figure 4.b Figure 1.a: Self-organizing maps of horizontal temperature advection, for winter (DJF), 1979-2002, ERA-40, in K/day. Figure 1.b: Sammon mapping, showing the distances between each node and its adjacent nodes as a distortion surface. Figure 4.a: Self-organizing maps of horizontal moisture advection, for winter (DJF), 1979-2002, ERA-40, in mm/day. Figure 4.b: Sammon mapping, showing the distances between each node and its adjacent nodes as a distortion surface. Figure 1.c Figure 1.d Figure 4.d Figure 4.c 3. Meridional temperature advection 5. Meridional moisture advection Figure 3.a Figure 5.a Figure 4.c: Node frequencies of occurrence for horizontal moisture advection, with gray highlighting significantly greater values than the expected value of 2.86% at the 99% confidence interval. Figure 4.d: Difference in the occupancy frequency of high AO minus low AO days for horizontal moisture advection, with black thick dashed line marking significant differences at the 99 % confidence level. Figure 1.c: Node frequencies of occurrence for horizontal temperature advection, with gray highlighting significantly greater values than the expected value of 2.86% at the 99% confidence interval. Figure 1.d: Difference in the occupancy frequency of high AO minus low AO days for horizontal temperature advection, with black thick dashed line marking significant differences at the 99 % confidence level. The most frequently occurring nodes of moisture advection show a narrow tongue of positive moisture advection across the Atlantic, north of Iceland, and negative advection south of Iceland. This narrow tongue of positive moisture advection appears to be shifting northward and weakening, as shown in the last column, bottom to top. On the left side of the SOM matrix there is an isolated node, showing weak negative moisture advection over the Norwegian Sea and strong positive moisture advection confined between Iceland and Greenland. The features of dominant moisture advection look somewhat similar to those of temperature. These patterns can also be associated with the positive mode of the Arctic Oscillation. Figure 3.a: As in 1.a but for meridional temperature advection The nodes that occur most frequently show a well-pronounced warm advection from southeastern Greenland across the Atlantic and moderate cold advection in the Norwegian and Barents Sea. This warm tongue gradually shifts northward and weakens (the nodes from the bottom to the top right corner of the SOM matrix). There are also a few prominent patterns with strong cold advection between Svalbald and Iceland and warm advection over Eurasia, between 30° and 60° E (top left), or around 90° E (bottom left). The majority of dominant nodes of temperature advection can be associated with the positive Arctic Oscillation that appeared to have experienced a positive trend over the last couple of decades of the 20th century. Figure 5.a: As in 4.a but for meridional moisture advection Figure 3.b Figure 5.b 2. Zonal temperature advection The most frequent nodes show a moderate warm advection along the east coast of Greenland, across the northeastern North America, and the Eurasian sector between 45º and 90º E. To the right of the first row a tongue of warm advection develops across the Atlantic, between the east Greenland coast and southern Scandinavia, with Eurasian warm advection peaking around 90º E. Cold advection develops between 30º and 60º E and south of Greenland. 6. Zonal moisture advection Figure 2.a These patterns show a dominance of nodes with weak to moderate positive moisture advection over Iceland, and a strong positive advection along the southeastern coast of Greenland (nodes to the left of the first row). The nodes in the last column show strong negative moisture advection west of Iceland, with positive advection east of Iceland and across the Scandinavian peninsula. Figure 2.b Figure 6.a Figure 6.b Figure 5.b: As in 4.c but for meridional moisture advection Figure 3.b: As in 1.c but for meridional temperature advection The dominant nodes depict a well-pronounced warm advection between Iceland and the Scandinavian peninsula, weaker warm advection across the northwestern Canada, and cold advection across the northeastern Canada. To the lower left of the map warm advection across the Atlantic intensifies and shifts westward, whereas the advection patterns across the American continent weaken, and cold advection develops over the Barents Sea. Nodes in the bottom right corner of the map occur most frequently. Those are the patterns of well-pronounced negative moisture advection along the east coast of Greenland, and positive advection east of Iceland. To the left of the last row negative advection is weaker, and the positive advection feature moves northwestward. The isolated node to the left shows strong positive moisture advection over Iceland. Figure 2.a: Self-organizing maps of zonal temperature advection, for winter (DJF), 1979-2002, ERA-40, in K/day. Figure 2.b: Frequency of occurrence for nodes of zonal temperature advection, shaded like described in 1.c. Figure 6.a: Self-organizing maps of zonal moisture advection, for winter (DJF), 1979-2002, ERA-40, in mm/day. Figure 6.b: Frequency of occurrence for nodes of zonal moisture advection, shaded like described in 4.c. • Method • SOM algorithm uses unsupervised learning process to find generalized patterns in data.. • In the first stage of training a map of reference vectors is created by distributing the nodes across the two-dimensional subspace defined by the two principal eigenvectors of the input data. • In the second stage the initial map is refined in the process of training, defined as mi(t+1)=hci(t)[x(t)-mi(t)], where t is the discrete-time coordinate, and hci(t) is the so-called neighborhood function, defined as • Alpha is the so-called learning-rate factor, which is an inverse function of time found experimentally to lead to convergence, and sigma is the so-called radius of training. Both the radius of training and the learning-rate decrease monotonically in time. For a selected radius of training, we vary learning-rate values and calculate mean quantization error of the final map. We choose the map with the smallest mean quantization error to best represent the system. Data Sets Advections are derived from the observed tropospheric winds, geopotential and specific humidity from ECMWF 40 Years Re-Analysis, ERA-40 daily fields from 1979-2002, http://data.ecmwf.int/data/d/era40_daily/. Equations Temperature advection is derived as Moisture advection is derived as , where precipitable water, pw, is defined as Acknowledgements This project is funded by the National Science Foundation, ARC-0455262. References Cassano, J. J., P. Uotila, A. H. Lynch, and E. N. Cassano (2006a), Changes in synoptic weather patterns in the polar regions in the 20th and the 21st century, Part 1: Arctic, Int. J. Clim., 26, 1027-1049. Hewitson, B.C., and R. G. Crane (2002), Self-organizing maps: applications to synoptic climatology, Clim. Res.., 22, 13-26. Kohonen, T. (1997), Self-Organizing Maps., 2nd ed.. Berlin: Springer-Verlag, pp. 86-144. Reusch, D. B., R. B. Alley, and B. C. Hewitson (2007), North Atlantic climate variability from a self-organizing map perspective, J. Geoph. Res., 112, 1-20. Sammon, J. (1969), A non-linear mapping for data structures and analyses, IEEE Trans. Computers, 18, 401-409.