Download
1 / 29
300 likes | 702 Vues
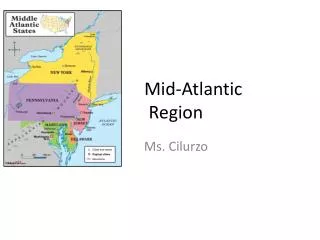
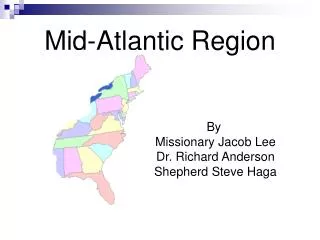
Genetic Diversity of Stream Fish Populations in the Mid-Atlantic Region. Suzanne Christ, Mark Bagley, Frank McCormick US Environmental Protection Agency, National Exposure Research Laboratory Cincinnati OH. What does genetic diversity have to do with vulnerability assessments?.

E N D
Genetic Diversity of Stream Fish Populations in the Mid-Atlantic Region Suzanne Christ, Mark Bagley, Frank McCormick US Environmental Protection Agency, National Exposure Research Laboratory Cincinnati OH
What does genetic diversity have to do with vulnerability assessments? ReVA Endpoints: • Resource Productivity • Clean Drinking Water • Biodiversity
What does genetic diversity have to do with vulnerability assessments? ReVA Endpoints: • Resource Productivity • Clean Drinking Water • Biodiversity
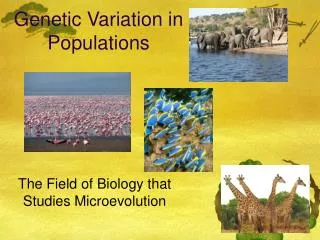
Ecosystem Species Genes Biodiversity
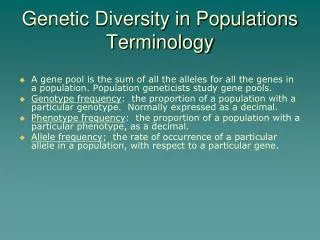
Genetic Diversity • Variation in the heritable portion of measurable traits that exists among individuals within a species. • Genetic diversity within populations • Genetic diversity among populations • Examples: eye color, height, blood type, HIV resistance
Δ Environment Δ Genetic Diversity Δ Vulnerability Inbreeding depression Heterozygosity Adaptation ( Environment tracking) Genetic Drift Inbreeding Population size Density Replacement rate variability Ne Demographic randomness Gilpin and Soule’s (1987) Extinction Vortex Model (Adaptation and inbreeding vortices) EXTINCTION
Spatial distribution of genetically distinct resource populations (ESUs)
Spatial distribution of genetically distinct resource populations (ESUs) • Unique resources • Biodiversity “Hotspots”
What does genetic diversity have to do with vulnerability assessments? • Indicator of population’s future “environmental buffering” ability • Reflective of past population stressor history • Defines the fundamental biological unit that we wish to assess (the population) • Prioritization based on uniqueness and vulnerability
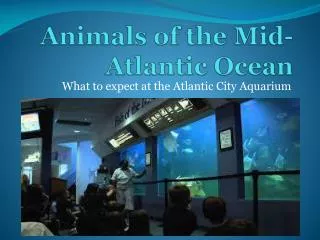
Genetics of Creek Chubs in a Coal Mining Region of the Mid-Atlantic Semotilus atromaculatus Photo courtesy of Ohio Dept. Natural Resources
Study Questions • Are there distinct population resources in the MAIA region? • Do watershed boundaries (HUCs) predict stream population boundaries? • Do levels of genetic diversity differ among sites? • What is the relationship between genetic diversity and environmental condition?
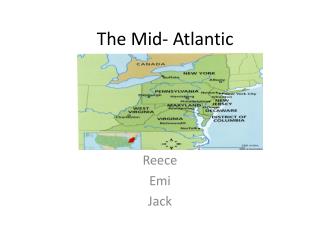
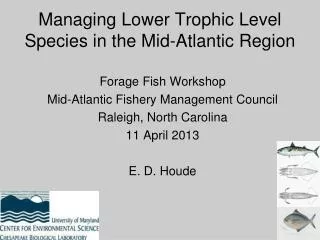
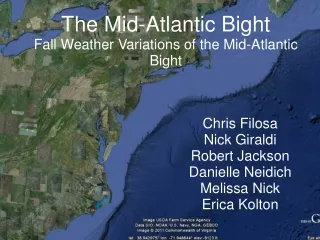
Study Area • Five watersheds assessed in MAIA pilot • 10 sample sites • Part of EMAP-MAIA 97-98 sampling • Wadeable streams (second and third order)
Genetic Analyses • 10-28 fish sampled per site • 590 bp of mitochondrial Cyt-B gene sequenced • AFLP fingerprints based on 109 polymorphic markers • Genetic differences within and among sites assessed by Analysis of Molecular Variance
Population genetic structure Mitochondrial DNA
Population genetic structure Nuclear DNA
Partitioning of Genetic Variance: Mitochondrial DNA Among Regions 64.8% Among Sites Within Sites Within Regions 27.8% 7.4%
Partitioning of Genetic Variance: Nuclear DNA Within Sites 86.6% Among Among Sites Regions Within Regions 5.4% 8.0%
Study Questions • Are there distinct population resources in the MAIA region? YES • Do watershed boundaries (HUCs) predict stream population boundaries? NOT 1:1 • Do levels of genetic diversity differ among sites? • What is the relationship between genetic diversity and environmental condition?
Study Questions • Are there distinct population resources in the MAIA region? YES • Do watershed boundaries (HUCs) predict stream population boundaries? NOT 1:1 • Do levels of genetic diversity differ among sites? YES • What is the relationship between genetic diversity and environmental condition? APPEARS TO BE STRONG
Complete Study • 3 stream minnows • MAIA and WAP • To be completed • later this year
More info: bagley.mark@epa.gov 513 569 7455 Acknowledgements Betsy Smith (ReVA) Tony Leonard (Sobran, Univ. of Cincinnati) EMAP program