Download
1 / 8
80 likes | 408 Vues
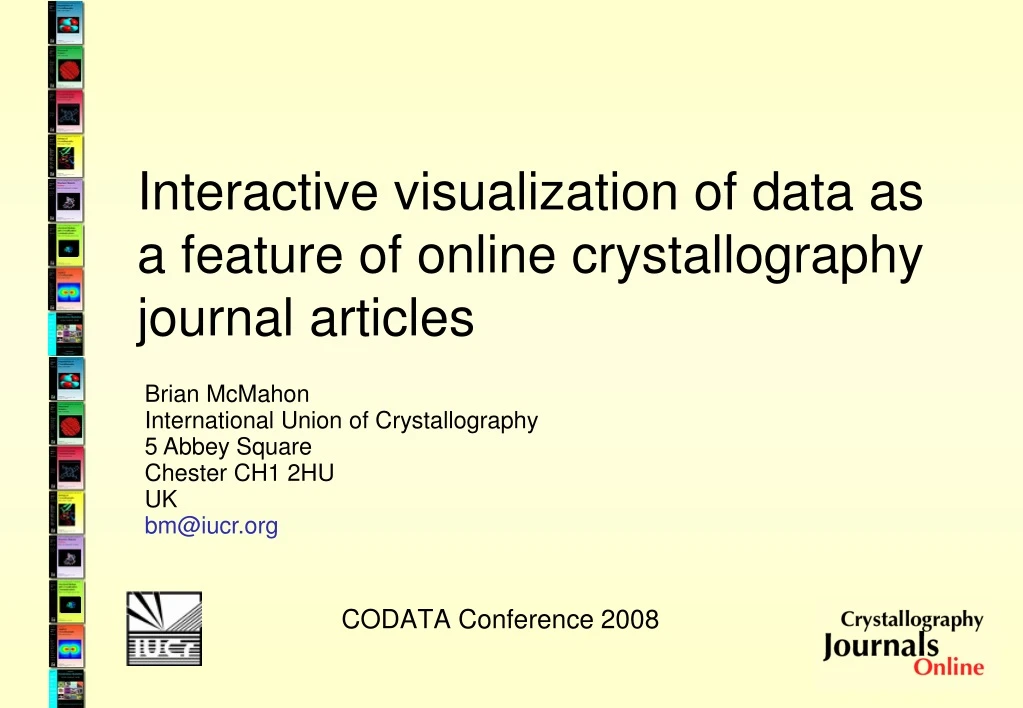
CODATA Conference 2008. Interactive visualization of data as a feature of online crystallography journal articles. Brian McMahon International Union of Crystallography 5 Abbey Square Chester CH1 2HU UK bm@iucr.org. Interactive molecular visualizations to enhance understanding. Rotate

E N D
CODATA Conference 2008 Interactive visualization of data as a feature of online crystallographyjournal articles Brian McMahon International Union of Crystallography 5 Abbey Square Chester CH1 2HU UK bm@iucr.org
Interactive molecular visualizations to enhance understanding • Rotate • Modify orientation • Alternative representations • Overlay representations • Interrogate • Long and honourable history: • Kinemage, Chime, RasMol • First Glance in Jmol, PDB but... • Platform dependent, require plugins, or supplementary information
Requirements for routine publication of enhanced figures • Platform independence • Web access for authors • Serving visualization application and data • Integration into submission/review procedures • Integration into journal production workflow • Automated generation of static copy (for failsafe/PDF edition/archiving) • Authoring tools
The authoring environment • The author uploads a data file (CIF) • The system provides different default styles according to the type of structure • The author edits and annotates the view • The author may supply additional scripts • The author saves the result as an enhanced figure + publication-quality static figure
Saving the enhanced figure • Interactive applet • Active scripts provided by the author • High-resolution static image • Option to view dynamic or static image online • Link to allow peer review
Submission/review • Author may prepare enhanced figure ahead of publication • Simply enter URL of edit workspace when asked to ‘upload source files’ • Presented alongside other conventional figures • Available for peer review • Can be edited in response to referee comments
The toolkit editing interface • Essential tool for authors • Accommodates novice and advanced users • Tabbed interface allows authors to concentrate • on scientific aspects of visualization • Presets tuned to journal style requirements • Live testing, preview and feedback mechanisms
Objectives • Enhance the scientific value of illustrations • Increase educational function • Allow readers to interact with the data • Preserve the essential aspects of the scientific argument • Enhance visual impact • Extend the scholarly authoring paradigm ‘...future generations [of scientific authors] will increasingly tell the scientific story using the talents of animators, of movie directors - and even of designers of interactive videogames.’


![[Journal Articles]](https://cdn1.slideserve.com/3429112/slide1-dt.jpg)