Download
1 / 7
70 likes | 426 Vues
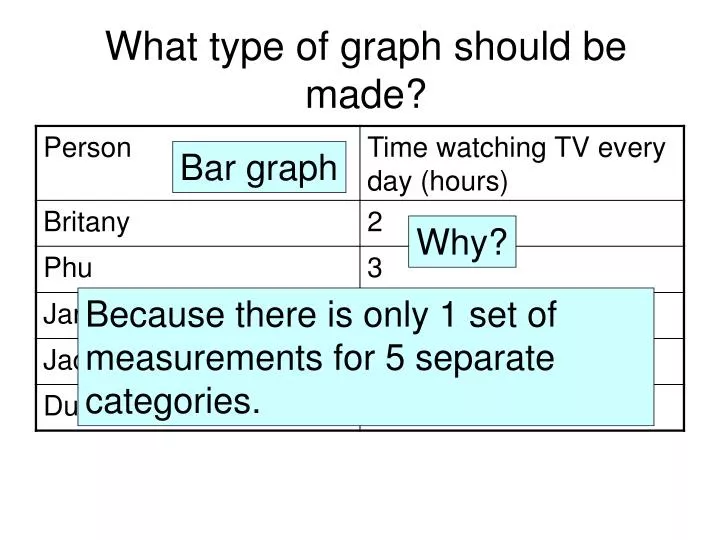
What type of graph should be made?. Bar graph. Why?. Because there is only 1 set of measurements for 5 separate categories. What type of graph should be made?. line graph. Why?. Because there 2 sets data measurements (manipulated and responding variable). What type of graph should be made?.

E N D
What type of graph should be made? Bar graph Why? Because there is only 1 set of measurements for 5 separate categories.
What type of graph should be made? line graph Why? Because there 2 sets data measurements (manipulated and responding variable).
What type of graph should be made? line graph Why? Because there 2 sets data measurements (manipulated and responding variable).
Which is the y axis? y axis
Which is the x axis? x axis
Which axis does the manipulated variable go on? On the x axis
Which axis does the responding variable go on? On the y axis