Download
1 / 73
770 likes | 1.32k Vues
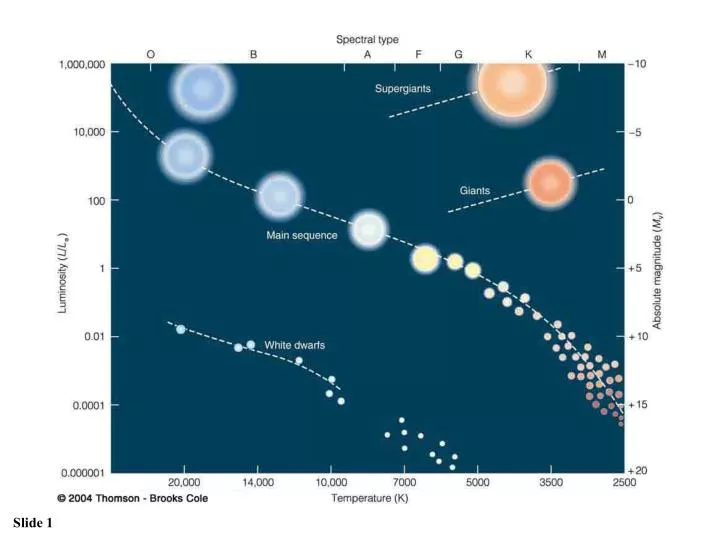
Need to know its luminosity, but it is difficult, because distance is unknown If you can estimate a star’s diameter and/or mass, you can figure out its luminosity Then you can also find the distance to this star. How to classify a star and to place it on the H-R diagram correctly??. 0.

E N D
Need to know its luminosity, but it is difficult, because distance is unknown If you can estimate a star’s diameter and/or mass, you can figure out its luminosity Then you can also find the distance to this star How to classify a star and to place it on the H-R diagram correctly??
0 The Radii of Stars in the Hertzsprung-Russell Diagram Betelgeuse Rigel 10,000 times the sun’s radius Polaris 100 times the sun’s radius Sun As large as the sun
0 The Relative Sizes of Stars in the Hertzsprung-Russell Diagram
How to distinguish between main-sequence stars and giants? Is there any spectral signature of giants? The width of spectral lines!
0 Spectral Lines of Giants Pressure and density in the atmospheres of giants are lower than in main sequence stars. => Absorption lines in spectra of giants and supergiants are narrower than in main sequence stars => From the line widths, we can estimate the size and therefore, the luminosity of a star. Distance estimate (spectroscopic parallax)
Luminosity Classes Ia Bright Supergiants Ia Ib Ib Supergiants II II Bright Giants III III Giants IV Subgiants IV V V Main-Sequence Stars
Ia bright supergiant Ib Supergiant II bright giant III giant IV subgiant V main-sequence star Luminosity classes
Example Luminosity Classes • Our Sun: G2 star on the Main Sequence:G2V • Polaris: G2 star with Supergiant luminosity: G2Ib
Measuring masses Mass is the most important parameter. Knowing masses of stars would allow us to calculate their luminosities, lifetime and all other properties. But how to measure masses??
Measuring masses Binary Stars More than 50 % of all stars in our Milky Way are not single stars, but belong to binaries: Pairs or multiple systems of stars which orbit their common center of mass. If we can measure and understand their orbital motion, we can estimate the stellarmasses.
The Center of Mass center of mass = balance point of the system. Both masses equal => center of mass is in the middle, rA = rB. The more unequal the masses are, the more it shifts toward the more massive star.
Center of Mass (SLIDESHOW MODE ONLY)
m1 m2
Estimating Stellar Masses RecallKepler’s 3rd Law: Py2 = aAU3 Valid for the Solar system: star with 1 solar mass in the center. We find almost the same law for binary stars with masses MA and MB different from 1 solar mass: aAU3 ____ MA + MB = Py2 (MA and MB in units of solar masses)
Examples: Estimating Mass Binary system with period of P = 32 years and separation of a = 16 AU: 163 ____ MA + MB = = 4 solar masses. 322 Arbitrary units: How to measure period and separation?
Visual Binaries The ideal case: Both stars can be seen directly, and their separation and relative motion can be followed directly.
Visual binaries The Castor system The Sirius system The two stars are separately visible in the telescope
Detecting the presence of a companion by its gravitational influence on the primary star. Wobbling motion of Sirius A
Spectroscopic Binaries Usually, binary separation a can not be measured directly because the stars are too close to each other. Stars are seen as a single point However: 1) their SPECTRA are different, like different fingerprints; 2) Their spectral lines shift periodically because of Doppler effect. This allows us to measure their orbital velocities
The Doppler Effect The light of a moving source is blue/red shifted by Dl/l0 = vr/c l0 = actual wavelength emitted by the source Dl = Wavelength change due to Doppler effect vr = radial velocity( along the line of sight) Blue Shift (to higher frequencies) Red Shift (to lower frequencies) vr
(Observed wavelength - Rest wavelength) Shift z = (Rest wavelength) The Doppler effect: apparent change in the wavelength of radiation caused by the motion of the source Doppler effect:
Doppler effect The Doppler effect: apparent change in the wavelength of radiation caused by the motion of the source RADIAL velocity!!
The Doppler Effect The Doppler effect allows us to measure the source’s radial velocity. Dl/l0 = vr/c vr
Spectroscopic Binaries The approaching star produces blue shifted lines; the receding star produces red shifted lines in the spectrum. Doppler shift Measurement of radial velocities Estimate of separation a Estimate of masses
Spectroscopic binaries Stars are seen as a single point • Spectra of both stars are distinguishable • Sometimes spectrum of only one star is seen
Spectroscopic Binaries (3) Typical sequence of spectra from a spectroscopic binary system Time
Measure the orbital period Measure the radial component of the orbital velocities Can estimate the orbit size Can determine masses!
1. Below is a radial velocity curve for a spectroscopic binary. Estimate the mass of each star if the mass of the binary system is 6 solar masses. MA dA = MB dB V ~ 2d/P
Only the function of masses and inclination angle can be measured
THE PLANET CANNOT BE SEEN ...BUT MOTIONS OF THE STAR BETRAY ITS PRESENCE !
450 km 9 cm/s 150 000 000 km 30 km/s X 750 000 km 13 m/s JUPITER X 780 000 000 km 13 km/s EARTH
2020 1995 2010 1990 2015 2005 2000 0.002” MOTIONS OF THE SUN VIEWED FROM A STAR 30 LIGHT YEARS AWAY 0.002’’ IS THE ANGULAR SIZE OF A MAN ON THE MOON OR A STANDARD NEWSPAPER FONT 300 KM AWAY Unobservable!
STELLAR WOBBLE RECEDING: REDDER APPROACHING: BLUER
EXPECTED: NEARLY CIRCULAR ORBITS BIG PLANETS FAR AWAY FROM THE STAR NO PLANETS BIGGER THAN JUPITER DISCOVERED: STRONGLY ELONGATED ORBITS BIG PLANETS VERY CLOSE TOTHE STAR MANY PLANETS BIGGER THAN JUPITER
Planetarysystem of u And 0.85 AU 242 days 2 MJ 2.5 AU 3.5 years 4 MJ 0.06 AU 4.5 days 0.75 MJ 0.73 AU 228 days 1 AU 1 year 0.39 AU 89 days 1.54 AU 1.9 years Solar system Source: Harvard-Smithsonian CfA
John Goodricke 1764-1786 Explained Algol puzzle in 1783
Eclipsing Binaries Usually, inclination angle of binary systems is unknown uncertainty in mass estimates. Special case: Eclipsing Binaries Here, we know that we are looking at the system edge-on!