Download
1 / 1
10 likes | 381 Vues
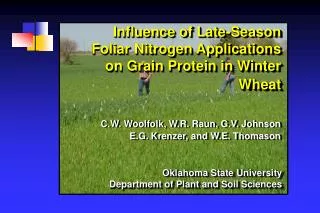
Late Season Nitrogen Enhanced Wheat Protein as Affected by Late Season Moisture. B. D. Brown. University of Idaho. Summary

E N D
Late Season Nitrogen Enhanced Wheat Protein as Affected by Late Season Moisture. B. D. Brown. University of Idaho Summary Late season N was more effective for enhancing protein of non-stressed high yielding wheat than moisture limited low yielding wheat, despite the higher total protein involved in a specific protein increase in more productive wheat. Baking quality as defined by bake volume was improved in each year as protein was enhanced with LSN, ESN, or yield limited by moisture during grain fill. Introduction High protein premiums and higher prices have increased traditional irrigated soft white wheat grower interest in the production of the hard red classes. Higher returns from the hard red class are dependent on avoiding discounted prices for low protein (< 14%). The importance of adequate nitrogen (N) for yield and protein is generally appreciated. Late season N (LSN), fertilizer applied at heading (Feekes 10.1-5) has increased wheat protein in several environments and the practice is common in many hard wheat production areas. But LSN rates appropriate for protein enhancement in limited rainfall low yield environments may not be appropriate for irrigated high yield environments. Producers of irrigated hard red wheat frequently fail to consistently raise wheat protein to desirable levels (14%) with low to moderate LSN rates reported in published studies (1,2). Yield is frequently limited by moisture during grain fill. The effect of moisture limited yield on the protein and baking quality response to LSN has received little attention. Higher wheat protein is generally associated with improved baking quality, thus the high protein premium and low protein discounts in market prices. But there are reports that LSN may not improve wheat baking quality even if wheat protein is increased (3). The objective of this study was to determine the response of protein and baking quality to LSN in wheat that varies in yield due to late season available moisture.. Methods A hard red spring wheat field study was conducted for four seasons (1995-98) at the University of Idaho Parma Research and Extension Center involving early season N (ESN) rates of 67 and 135 kg ha-1, LSN rates of 45 and 90 kg ha-1 applied at heading, and irrigation treatments (IR) of 0, 0.5, and 1.0 times estimated ET from the last uniform wetting. ESN and LSN were topdressed urea incorporated with sprinkler irrigation. Treatments were arranged as a split plot randomized complete block design with four replications. The ESN rate and IR treatments were randomized among the main plots. Main plots were 3 m wide and 27.4 m long and were divided into three subplots each 9.1 m long The soil was a Greenleaf-Owyhee silt loam (fine-silty, mixed, mesic, Xerollic haplargids). Previous crops were sudan grass (1995-97 seasons) and potatoes (1998 season). Vandal hard red spring wheat was seeded at 110 kg ha-1 with 17.8 cm row spacing. The wheat received uniform rainfall or sprinkler irrigation through the boot to heading stage. The IR treatments during grain filling were imposed using a drip irrigation system. Four drip lines were spaced 0.6m apart and parallel to the planted rows in the 3.0 m wide main plots that received additional water during grain fill. Different amounts of moisture were applied during each drip irrigation set by spacing emitters 30 cm (full irrigation) or 60 cm (0.50 estimated ET) in the drip line. Bureau of Reclamation (BOR) evapotranspiration estimates from the Agrimet System were used to schedule irrigations after heading. Grain yield was measured with a small plot combine from 11.6 m2 . The moisture corrected (12%) protein was determined using NIR and baking quality was determined using AAcC method No. 10-10B at the University of Idaho Aberdeen Wheat Quality Laboratory. Bake volume was determined using rape seed displacement. All data were analyzed using analysis of variance procedures available in SAS. Results continued In contrast, protein in 95 increased as yield increased with added moisture because the LSN topdressed by hand was not as available for uptake in the non-irrigated treatment due to dry soil conditions at the LSN positioned depth. Protein increased linearly in all years with each increment of LSN, unless protein without LSN was above 17% (Figure 3). Except for 95, protein was highest when yield was limited by moisture stress during grain fill. Generally 45 kg ha-1 wasneeded to raise protein from 13% to 14%. Baking Quality Bake volume increased each year with higher protein regardless of whether the protein increase was due to higher ESN, lower yields from moisture stress during grain fill, or LSN (Figure 4). Bake volume improvement with LSN was limited if wheat with no LSN was higher than 15% protein. Bake volume was higher in 97 (1154 cm3) and 98 (1182 cm3) than in 95 (1026 cm3) and 96(1020 cm3). Bake volume was affected by IR treatments in all years except 97. Improvement in bake volume with LSN tended to be greatest with the first LSN increment of 45 kg ha-1. Further improvement in bake volume occurred with the second LSN increment, but unlike the protein improvement, the improvement in bake volume with LSN was not linear. Either the protein measurement reflects non-protein N that increases with LSN or the protein resulting from high LSN is poorer in quality for bread making. Baking volumes were not consistently related to specific protein concentrations. For example, 96 bake volumes associated with protein above 17% were smaller than in 97 or 98 wheat testing less than 14% protein. Baking quality is clearly dependent on more than crude protein. Nevertheless, baking quality was invariably improved when protein was enhanced with LSN at heading. Results continued were delayed in 97 and 98 since rainfall or soil moisture was believed adequate. By the end of the season, wettest and driest IR treatments differed by 16.5, 32.6, 12.7, and 17.4 cm water received for the 95, 96, 97, and 98 seasons, respectively. IR treatments differed more in 96 because they were started earlier and there was little rainfall during the rest of the season. Grain Yield Grain yield was higher with the 135 kg ha-1 ESN rate in 1996 (4.27 vs 3.97 Mg ha-1) and 1998 (6.10 vs 5.88 mg ha-1) but did not differ significantly in other years. Grain yield increased significantly with late season N only in 1997, increasing from 6.20 to 6.66 Mg ha-1. There were no significant yield interactions involving LSN. Water added at the 0.5ET rate during grain fill increased yield in all seasons but the full irrigation treatment was necessary for maximum production in only 96 and 97 (Figure. 2). Yield increased from as little as 28% to as much as 286% with additional water during grain fill. The full irrigation treatments provided less than the predicted ET by the end of the season in all years. But yields were not affected by end of season ET deficits of 25 cm in 95 and 17 cm in 98. Soil moisture was no doubt used in part to make up part of the deficit. It is also likely that BOR predicted ET was greater than actual ET, particularly late in the grain filling period. Protein Protein increased in all years with the highest ESN rate with increases ranging from 0.3 to 0.9% for the extra 67 kg ha-1 N added. Except for the 95 season, protein declined as yield increased from the first increment of added water (Figure 2). This was especially evident in 1996 when yield increased almost threefold with the wettest treatment and protein decreased from 17.5 to 13%. Discussion We anticipated that LSN for enhancing protein would be more effective when yield was limited since more N was available per unit of grain produced and the total protein N associated with a change in protein concentration would be less in lower than higher yielding wheat. On the contrary , we found the protein increase with LSN was greatest in years with the highest yields, as in 97. Within years, the protein increase with LSN was either no different or considerably higher in the most productive wheat as compared to the yield limited by reduced moisture. The greater efficiency of LSN under higher yields and well watered conditions may be attributed in part to greater root access to LSN as periodic wetting maintained root activity at LSN positioned depths. The results may not be relevant for foliar LSN applied at rates that would avoid leaf burn. Also, more efficient utilization of N taken up by wheat can not be ruled out. Few studies have employed top-dressed LSN rates for protein enhancement as high as the 90 kg ha-1 used in our study. The results suggest that the efficiency of protein enhancement under well watered conditions does not differ for moderate and high LSN rates, provided protein is not high to begin with. Figure 2. Mean yield (dark symbols) and protein (open symbols) as affected each year by late season water (IR treatments). Figure 3. Mean protein as affected by late season N at heading and moisture provided during grain fill. Bars within figures are the LSD.05 for the LSN effect.. Figure 1. Cumulative ET and water (irrigation and rainfall) received each season after May 14 for IR treatments. References 1. Stark, J. C., and T. A. Tindall. 1992. Timing split applications of nitrogen for irrigated hard red spring wheat. J. Prod. Agric. 5:221-226. 2. Christensen, N. W. , and R. J. Killorn. 1981. Wheat and barley growth and N fertilization under sprinkler irrigation. Agron. J. 73:307-312. 3. Sylvester-Bradley, R. 1990. Does extra nitrogen applied to breadmaking wheat benefit the baker. In “Cereal Quality II” Aspects of Applied Biology No. 25, Association of Applied Biologists pp. 217-228. Results Moisture Received Cumulative ET (CumET) and cumulative water received from irrigation and rainfall (Cumwat) after May 15 or jointing (Feekes 6) are indicated in Figure 1 for each year and IR treatment. Water received uniformly as rain or irrigation after May 15 (UW) was 5.1 cm in 95, only 1.5 cm in 96, 7.8 cm in 97, and 5.3 cm in 98. IR treatments Acknowledgement This field study was accomplished with the technical support of Dr. Roger Gibson, Scientific Aide, and seasonal employees Janet Murakami and Vernon Booth. The baking quality determinations were obtained with the cooperation of Kathryn O’Brien and the University of Idaho Aberdeen Wheat Quality Laboratory. Figure 4. Mean bake volume as affected by late season N at heading and moisture provided during grain fill. Bars within figures are the LSD.05 for the LSN effect