Download
1 / 24
260 likes | 2.16k Vues
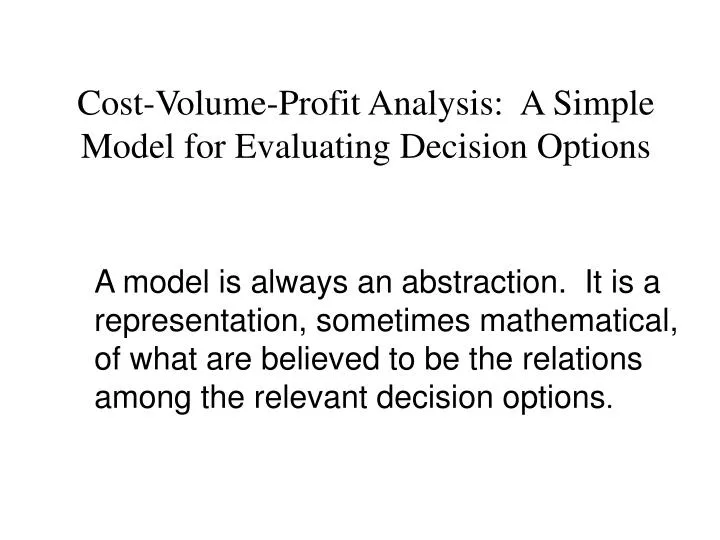
Cost-Volume-Profit Analysis: A Simple Model for Evaluating Decision Options A model is always an abstraction. It is a representation, sometimes mathematical, of what are believed to be the relations among the relevant decision options . Sample Questions Raised and Answered by CVP Analysis

E N D
Cost-Volume-Profit Analysis: A Simple Model for Evaluating Decision Options • A model is always an abstraction. It is a representation, sometimes mathematical, of what are believed to be the relations among the relevant decision options.
Sample Questions Raised and Answered by CVP Analysis 1. How many units must be sold (or how much sales revenue must be generated) in order to break even? 2. How many units must be sold to earn a before-tax profit equal to $60,000? A before-tax profit equal to 15 percent of revenues? An after-tax profit of $48,750? 3. Will total profits increase if the unit price is increased by $2 and units sold decrease 15 percent? 4. What is the effect on total profit if advertising expenditures increase by $8,000 and sales increase from 1,600 to 1,750 units?
Sample Questions Raised and Answered by CVP Analysis (cont’d) 5. What is the effect on total profit if the selling price is decreased from $400 to $375 per unit and sales increase from 1,600 units to 1,900 units? 6. What is the effect on total profit if the selling price is decreased from $400 to $375 per unit, advertising expenditures are increased by $8,000, and sales increased from 1,600 units to 2,300 units? 7. What is the effect on total profit if the sales mix is changed?
Vocabulary • Gross Margin = Revenue - Cost of goods sold.All costs are manufacturing costs. Some of them are fixed costs. • Contribution margin = Revenue - Variable costsSome variable costs are manufacturing costs, but some may be non-manufacturing costs. None are fixed costs. • Gross margin percent = Gross margin/Revenue • Contribution margin percent = Contribution margin/Revenue
Gross margin: • Cost of goods sold = Direct materials • Direct labor • Applied overhead • Applied overhead = units produced x predetermined O/H • Gross Margin = Revenue - COGS.
Contribution margin: • Variable costs = manufacturing variable costs + • non-manufacturing variable costs. • Gross margin + fixed mfg. overhead – non-manufacturing variable costs = Contribution margin. • Contribution margin + non-manufacturing variable costs - fixed mfg. costs = Gross margin.
Safety margin: • The dollar amount by which sales revenue exceeds what is required to break even. • The number of units by which sales exceed what is required to break even.
The Model • The fundamental accounting equation • Profit () = Revenues - Costs • Revenue = SP*units sold • SP = selling price • Costs = FC + VC(units manufactured) • FC = fixed cost • VC = unit variable costs. • We are assuming that units manufactured equal units sold
What if we want to know how much product we must sell to break even? The breakeven point is the point where profit is zero, so = 0 = Revenue - Cost = SP*units sold - FC - VC*units sold = (SP - VC)*units sold - FC units sold = FC/(SP - VC) We will call units sold at = 0: BEunits
Breakeven revenue Breakeven units (BEunits) * SP, or SP * BEunits = SP*(FC/CM) Breakeven revenue = FC/(CM/SP)
Cost-Volume-Profit Graph Total Revenue Revenue Profit Total Cost Y Loss X Unit sold X = Break-even point in units Y = Break-even point in revenue
Profit-Volume Graph I = (P - V)X - F Profit Slope = P - V Units Loss Break-Even Point In Units - F
Assumptions underlying CVP analysis • In manufacturing firms, the inventory levels at the beginning and end of the period are the same. This implies that the number of units produced during the period equals the number of units sold. • The behavior of total revenue is linear (straight line). This implies that the price of the product or service will not change as sales volume varies within the relevant range.
Assumptions underlying CVP analysis • The behavior of costs is linear (straight line) over the relevant range. This implies the following more specific assumptions. • a. Costs can be categorized as fixed, variable, or semi-variable. Total fixed costs remain constant as activity changes, and the unit variable cost remains unchanged as activity varies. • b. The efficiency and productivity of the production process and workers remain constant.
Assumptions underlying CVP analysis • In multi-product organizations, the sales mix remains constant over the relevant range. • In multi-product organizations, when we do a single CVP analysis, we assume the products all are sold in the same market. Substitutes. • This means that the product mix does not change in response to changes in production/sales volume.
Example 1: equation approach • Movie theater: $48,000 monthly fixed costs • $8 ticket price. • $2 variable cost per ticket. • Give breakeven units and revenue • BEunits = $48,000/($8 - $2) • BEunits = 8,000 tickets. • BErevenue = $64,000
Example 1 Cont’d • Suppose practical capacity per month is 12,000 tickets and that the movie theater has operated at 60% capacity during December. It is now December 30. • Has the theater made money in December? • If they could capture 1,000 customers by lowering the ticket price to $7 for New Year’s Eve, should they do it?
Example 2 Data: The Doral Company manufactures and sells pens. Present sales output is 5,000,000 per year at a selling price of $.50 per unit. Fixed costs are $900,000 per year. Variable costs are $.30 per unit. • What is the current yearly operating income? • What is the current breakeven point in sales dollars?
Example 2 Cont’d Compute the new operating income if . . . 1. A $.04 per-unit increase in variable costs. 2. A 20% decrease in fixed costs, a 20% decrease in selling price, a 10% decrease in variable costs, and a 40% increase in units sold.
Example 2 Cont’d Compute the new breakeven point in units for each of the following changes. • A 10% increase in fixed costs: • A 10% increase in selling price and a $20,000 increase in fixed costs.
Example 3 The Rapid Meal has two restaurants that are open 24 hours per day. Fixed costs for the two restaurants together total $450,000 per year. Service varies from a cup of coffee to full meals. The average sales check for each customer is $8.00. The average cost of food and other variable costs for each customer is $3.20. The income tax rate is 30%. Target net income is $105,000.
Example 3 Cont’d Compute the total dollar sales needed to obtain the target net income. How many sales checks are needed to break even? Compute net income if the number of sales checks is 150,000
Multiple-Product Example Assume the following: Regular Deluxe Total Percent Units sold 400 200 600 ---- Sales price per unit $ 500 $750 ---- ---- Sales $200,000 $150,000 $350,000 100.0% Less: Variable expenses 120,000 60,000 180,000 51.4 Contribution margin $ 80,000 $ 90,000 $170,000 48.6% Less: Fixed expenses 130,000 Net income $ 40,000 ======= 1. What is the break even point? 2. How much sales revenue of each product must be generated to earn a before tax profit $50,000?