Download
1 / 9
90 likes | 97 Vues
A Quantitative Structure Activity Relationship (QSAR) study of 3, 4-Diaryloxazolones has been<br>performed to evaluate the descriptors responsible for the COX-2 inhibitory activity of the<br>molecules. The molecular modeling studies were performed using CS Chem.Office 2005<br>molecular modeling software ver. 9.0. Allinger’s MM2 force field and semiempirical AM1<br>(Austin Model 1) Hamiltonian method (MOPAC module) were used to minimize the energy and<br>energy minimized geometry was used to calculate 40 different descriptors. Stepwise multiple<br>linear regressions were performed to obtain the QSAR models. An analysis of the QSAR models<br>was performed to select the best model which suggests that steric and electronic parameters of the molecules are highly correlated with COX-2 inhibitory activity.

E N D
Available on line www.jocpr.com Journal of Chemical and Pharmaceutical Research __________________________________________________ J. Chem. Pharm. Res., 2011, 3(1):160-168 ISSN No: 0975-7384 CODEN(USA): JCPRC5 A QSAR Study of 3, 4-Diaryloxazolones as Cyclooxygenase-2 Inhibitors Jignasa K. Savjani, Anuradha K. Gajjar and Anuradha K. Gajjar Department of Pharmaceutical Chemistry, Institute of Pharmacy, Nirma University, Ahmedabad, Gujarat ______________________________________________________________________________ ABSTRACT A Quantitative Structure Activity Relationship (QSAR) study of 3, 4-Diaryloxazolones has been performed to evaluate the descriptors responsible for the COX-2 inhibitory activity of the molecules. The molecular modeling studies were performed using CS Chem.Office 2005 molecular modeling software ver. 9.0. Allinger’s MM2 force field and semiempirical AM1 (Austin Model 1) Hamiltonian method (MOPAC module) were used to minimize the energy and energy minimized geometry was used to calculate 40 different descriptors. Stepwise multiple linear regressions were performed to obtain the QSAR models. An analysis of the QSAR models was performed to select the best model which suggests that steric and electronic parameters of the molecules are highly correlated with COX-2 inhibitory activity. Key words: QSAR, COX-2 inhibitors, Diaryloxazolones, NSAIDs, Multiple linear regression. _____________________________________________________________________________ INTRODUCTION The use of nonsteroidal anti-inflammatory drugs (NSAIDs) for the treatment of inflammation and pain is often accompanied by gastrointestinal ulcerations and bleeding. In the early, 1990s, the discovery of the two isoforms of cyclooxygenase (COX), the enzyme catalyzing the conversion of arachidonic acid to prostaglandins and thromboxanes, clarified the understanding of the therapeutic as well as adverse effects of NSAIDs. The two isoforms of COX, COX-1 & COX-2 are almost identical in structure but have important differences in the substrate and inhibitor selectivity, intracellular location and tissue distribution. COX-1 regulates functions such as vascular homeostasis and gastroprotection, whereas COX-2 regulates various inflammatory reactions. In addition COX-2 is also known to be induced in kidneys in response to sodium (Na+) depletion or hyper filtration state; in post synaptic excitatory neurons in brain and 160
Jignasa K. Savjani et al J. Chem. Pharm. Res., 2011, 3(1):160-168 ______________________________________________________________________________ in colon adenoma and carcinoma cells. The therapeutic effect of nonselective NSAIDs such as Aspirin, Indomethacin etc. is due to inhibition of COX-2 as well as COX-1 which leads to unwanted side effects. The identification and isolation of COX-2 has therefore led to the suggestion that the successful development of selective inhibitors will provide a new generation of NSAIDs with significantly reduced toxicity and improved safety. Both isoforms of the enzyme are encoded by separate genes on different chromosomes; COX-1 is on chromosome 9, while COX-2 on chromosome 1. COX-2 gene contains regions characteristic of early response genes, allowing a rapid up regulation in response to inflammatory stimuli as well as rapid turnover and diminished expression in the absence of continued stimulation. COX-1 gene is expressed in almost all normal tissues and is not up regulated in inflammatory stimuli (constitutive expression). Apart from many notable similarities in the binding sites of COX-1 and COX-2, it is important to identify and characterize the differences between them to understand the different behavior of anti-inflammatory agents and their selectivity towards COX-1 and COX-2; to aid drug design using this structural information. The different binding sites of the two isoenzymes and the interaction of a drug with COX-1 and COX-2 contribute to the understanding of the pharmacological activity and drug selectivity. The main reason for drug selectivity between COX-1 and COX-2 is due to slight differences in the side pocket of the hydrophobic channel. The side pocket in COX-2 is 20% larger than in COX-1 i.e. 394 Ao in COX-2 and 316 Ao in COX-1. This explains the increased promiscuity of COX-2 for fatty acid substrate of different chain lengths and the ability of COX-2 to metabolize larger neutral derivatives of arachidonic acid. The cyclooxygenase accessibility is mostly determined by the residue located at position 523. COX-1 has an isoleucine at the position, while COX-2 has valine. The smaller valine side chain in COX-2 provides the selective inhibitors get greater access to the side pocket. Further, exchange of valine-isoleucine at position 434 is responsible for the formation of a gate. In COX-2 less bulky valine is able to swing like a gate and offer enough space for entry of a molecule with room fitting substituents [1]. Many selective COX-2 inhibitors have been reported since the mid-1990`s. Vicinal diaryl heterocycles are the most investigated and important class and include celecoxib and rofecoxib. In the diaryl heterocyclic class of COX-2 inhibitors, it has been well established that a p-methyl sulfone or sulfonamide on one of the phenyl groups is a requirement for good COX-2 potency and selectivity [2]. A QSAR (Quantitative Structure Activity Relationship) analysis was performed on a series of 3, 4- Diaryloxazolones in order to gain insight into the physicochemical requirements of the molecules to exhibit selective COX-2 inhibitory action. EXPERIMENTAL SECTION The data set of total 29 compounds was taken from published literature [4]. All the values of biological data were expressed as IC50 values in micromolar unit. In the present study biological activity data were first converted to negative logarithmic unit (pIC50). The general structure of the analogs is shown in “Fig. (1)” and the selected compounds with their biological activity data are shown in Table 1. 161
Jignasa K. Savjani et al J. Chem. Pharm. Res., 2011, 3(1):160-168 ______________________________________________________________________________ O R1 N O R3 R2 S O O Fig. (1). General structure of 3, 4-Diaryloxazolones Table 1. COX-2 inhibitory activity of some 3, 4-Diaryloxazolones Compound R1 1 C6H5 2 2-F C6H4 3 4-F C6H4 4 4-Cl C6H4 5 4-CH3 C6H4 6 4-CH3CH2 C6H4 7 2, 4-diF C6H3 8 C6H5 9 2-F C6H4 10 4-F C6H4 11 2-Cl C6H4 12 3-Cl C6H4 13 4-Cl C6H4 14 4-CF3 C6H4 15 2-CH3 C6H4 16 4-CH3 C6H4 17 4-CH3CH2 C6H4 18 4-CH3O C6H4 19 3-HOOC C6H4 20 4-HOOC C6H4 21 2, 4-diF C6H3 22 4-CH3O,3-F C6H3 23 4-CH3O,3-Cl C6H3 24 1-naphthyl 25 C6H5 26 4-F C6H4 27 3-CH3 C6H4 28 4-CH3 C6H4 29 3, 4-diCl C6H3 R2 CH3 CH3 CH3 CH3 CH3 CH3 CH3 NH2 NH2 NH2 NH2 NH2 NH2 NH2 NH2 NH2 NH2 NH2 NH2 NH2 NH2 NH2 NH2 NH2 NH2 NH2 NH2 NH2 NH2 R3 H H H H H H H H H H H H H H H H H H H H H H H H CH3 CH3 CH3 CH3 CH3 pIC50 -0.20 0.18 0.29 0.49 0.32 0.16 -0.13 -0.38 -0.34 -0.18 -0.81 -0.18 -0.08 -0.30 -0.99 0.10 -0.19 0.68 -2.00 -1.77 -0.36 -0.05 0.11 -0.67 -0.26 0.29 0.03 -0.23 0.64 Molecular modeling studies were performed using CS Chem office, 2005 molecular modeling software ver. 9.0, supplied by Cambridge Software Company. The structure of each compound was drawn in ChemDraw Ultra 9.0 and copied to Chem3D Ultra 9.0 to create a 3-D model. Each structure was cleaned up and energy minimization was performed using Allinger’s MM2 force field by fixing Root Mean Square (RMS) gradient to 0.1 Kcal mol-1Å. Further geometry optimization was done using semiempirical AM1 (Austin Model 1) Hamiltonian method, closed shell restricted wave function available in the MOPAC module until the RMS value smaller than 162
Jignasa K. Savjani et al J. Chem. Pharm. Res., 2011, 3(1):160-168 ______________________________________________________________________________ 0.001 Kcal mol-1Å was achieved. Energy minimized geometry was used for calculation of thermodynamic (15), steric (17) and electronic (8) descriptors, as mentioned in Table 2 [3]. Table 2. Descriptors used in the present study Sr.No Descriptor/unit 1 Boiling Point (BP)/ (K) 2 Critical Pressure (CP)/ (bar) 3 Critical Temperature (CT)/ (K) 4 Critical volume (cm3 / mol) (CV) 5 Heat of formation (HoF)/ (Kcal/mol at 25 °C) 6 Henry's Law Constant (HLC)/ (log) 7 Ideal Gas Thermal Capacity at 25°C & 1atm (IGTC)/ (J/mol.K) 8 Log Partition Coefficient (logP) 9 Melting Point (MP)/ (K) 10 Molar Refractivity (MR1)/ (cm3/mol) 11 Standard Gibbs Free Energy (SGFE)/ (kJ/mol) 12 Vapor Pressure at 25°C (VP)/ (Pa) 13 Total Energy (TE)/ (eV) 14 Molar Refractivity (MR2) 15 Partition Coefficient (Octanol/Water) (PC) 16 Dipole (debye) 17 DipoleLength (DL)/ (eV) 18 ElectronicEnergy (EE)/ (eV) 19 HOMO Energy (HOMO)/ (eV) 20 LUMO Energy (LUMO)/ (eV) 21 Repulsion Energy (RE)/ (eV) 22 Formal Charge (FC) 23 Sum Of Valence Degrees (SVD) 24 Balaban Index (BI) 25 Cluster Count (CC) 26 Diameter (Dia) 27 Connolly Accessible Area (CAA)/ (A°2) 28 Connolly Molecular Area (CMA)/ (A°2) 29 Connolly Solvent-Excluded Volume (CSEV)/ (A°3) 30 Molecular Topological Index (MTI) 31 Principal Moment of Inertia - X(PMIX) /(g/mol.A°2) 32 Principal Moment of Inertia - Y (PMIY)/ (g/mol.A°2) 33 Principal Moment of Inertia - Z (PMIZ)/ (g/mol.A°2) 34 Shape Attribute (SA) 35 Radius (Rad) 36 Polar Surface Area (PSA) 37 Exact Mass (Mass)/ (g/mol) 38 Wiener Index (WI) 39 Molecular Weight (Weight)/ (atomic mass unit) 40 Ovality (OVL) Stepwise multiple linear regression was performed using SigmaStat 3.0 and Regression machine (QSAR-PC:PAR) in order to obtain QSAR models. Statistical quality of the models was judged by correlation coefficient (r), squared correlation coefficient (r2), adjusted squared correlation coefficient (r2adj), Standard Error of Estimate (SEE) and Fischer’s Value (F). r2 is the relative measure of quality of fit of the model; r2adj explains the variance in biological activity; SEE Type of descriptor Thermodynamic Electronic Steric 163
Jignasa K. Savjani et al J. Chem. Pharm. Res., 2011, 3(1):160-168 ______________________________________________________________________________ represents the absolute measure of quality of fit and F represents the F-ratio between the variance of calculated and observed activity. PRESS is the standard deviation of sum of square of difference between predicted and observed values. RESULTS AND DISCUSSION COX-2 inhibitory activity data and various molecular descriptors were taken as dependent and independent variables respectively and correlation was established between them by employing stepwise multiple linear regression. The orthogonality of descriptors in the selected correlations was confirmed by the calculation of overall correlation matrix and tolerance level of each descriptor is shown in tables 3 and 4 respectively. In regression analysis, r is relative measure of the quality of fit of the model since the value depends on overall variance of the dependent variable. Tolerance is defined as (1-r2) where r2 is a measure of explained variance given as %. Tolerance values range from 0.0 to 1.0. If tolerance value of an independent variable is 1.0, it is totally independent of the other predictor variables, where as if it is 0.0, it is totally collinear with the other independent variables. Further, the selected models were checked for any autocorrelation by calculating Durbin-Watson (D-W) Statistics. Among the many correlations generated, statistically significant models were selected for further consideration. The most significant QSAR models with two, three and four descriptors are, Model – 1 pIC50 = 15.520 + (1.439 * HOMO) - (0.0233 * PSA) n is 29, r = 0.784, r2 = 0.615, r2adj = 0.585, SEE = 0.250 Fcal = 20.54, Ftab = 5.53, Tabulated t-test value = 2.0256 (95 %) q2 = 0.5023, PRESS = 5.084 Durbin-Watson Statistic = 2.386 Model – 2 pIC50 = 13.451 + (0.0104 * Mass) + (1.550 * HOMO) - (0.0280 * PSA) n is 29, r = 0.838, r2 = 0.703, r2adj = 0.667, SEE = 0.390 Fcal = 19.59, Ftab = 4.68, Tabulated t-test value = 2.06 (95 %) q2 = 0.6006, PRESS = 4.094 Durbin-Watson Statistic = 2.579 Model – 3 pIC50 = 15.556 -(0.00674*BP) +(0.0113*Mass) +(1.296* HOMO) - (0.0228* PSA) n is 29, r = 0.902, r2 = 0.814, r2adj = 0.783, SEE = 0.282 Fcal = 26.31, Ftab = 4.22, Tabulated t-test value = 2.064 (95 %) q2 = 0.6785, PRESS = 3.309 Durbin-Watson Statistic = 2.247 where, n is the number of data points, r is correlation coefficient (a relative measure of quality of fit of the model), r2 is squared correlation coefficient which explains variance in activity, r2adj is the explained variance (EV) calculated as r2adj = r2 (1-1/Fcal) that accounts in percentage when multiplied by 100 for the variance in the activity, SEE is the standard error of estimate or standard deviation; it is an absolute measure of quality of fit, lesser the value of SEE, higher will be the accuracy with which the expected activity of a new molecule may be predicted. q2 is cross-validated squared correlation coefficient which indicates internal predictivity of the model. 164
Jignasa K. Savjani et al J. Chem. Pharm. Res., 2011, 3(1):160-168 ______________________________________________________________________________ F-value is the measure of level of statistical significance of regression model. Fcal is the calculated F value and Ftab is the tabulated F value. It indicates statistical validity of the equation at specific significance level (0.01); if Fcal value exceeds Ftab, it indicates that correlation is not by chance but a true relationship exists. t-test was performed to assess the significance of individual coefficients. Table 3. Correlation matrix of descriptors in the selected models pIC50 PSA pIC50 1.000 PSA -0.672 1.000 HOMO 0.437 -0.053 Mass -0.046 0.412 BP -0.640 0.428 Table 4. t-statistics and tolerance values for the descriptors in the selected models Model No. Constant/descriptor Constant HOMO PSA Constant Mass HOMO PSA Constant BP Mass HOMO PSA Model 3 (with 4 descriptors) has high correlation coefficient and low standard error of estimate. This equation is selected as the best model for further discussion. In comparision to model 1 and model 2, the addition of thermodynamic factors like boiling point and mass, increases the predicting ability of the QSAR equation. This model accounts for 81.4 % of the COX-2 inhibitory activity of 3,4-diaryloxazolones. F-statistics proves it to be statistically highly significant (more than 99.9 %) as the calculated Fischer value (F) exceeds the Tabulated F value. The model demonstrates good internal predictivity as the value of q2 is greater than 0.65. Low standard error of estimate suggests a high degree of confidence in the analysis. The values of intercorelation coefficients indicate lack of multicolinearity as shown in table 3, which was further reaffirmed by checking the tolerance level of each descriptor as indicated in table 4, which is closer to one. T-statistics shows that regression coefficients are highly significant as the calculated t-values exceed the tabulated t-value at 95 % confidence. This model has very good predictive power. Calculated values of all the descriptors in the selected models are shown in table 5. Predicted activity values were calculated for each compound using the correlation developed and a comparison was made with the observed value as shown in table 6. A graph of observed and predicted COX-2 inhibitory activity indicates the efficient predictive ability of the selected model (Model 3) as shown in “Fig. (2)”. HOMO 1.000 -0.122 -0.215 Mass 1.000 0.257 BP 1.000 Tolerance ---- 0.997 0.997 ---- 0.821 0.986 0.830 ---- 0.774 0.816 0.943 0.716 t-value 3.892 3.322 -5.316 3.683 2.721 3.974 -6.528 5.188 -3.794 3.656 4.026 -6.106 Model 1 Model 2 Model 3 165
Jignasa K. Savjani et al J. Chem. Pharm. Res., 2011, 3(1):160-168 ______________________________________________________________________________ Table 5. Calculated values of Descriptors of Model-3. BP (K) Mass (g/mole) 762.897 315.057 760.224 333.047 760.224 333.047 781.592 349.018 774.496 329.072 786.1 343.088 782.061 316.052 779.388 334.042 779.388 334.042 779.388 334.042 800.756 350.13 800.756 350.13 800.756 350.13 785.472 384.039 793.66 330.067 793.66 330.067 805.264 344.083 723.51 346.062 864.495 360.042 864.495 360.042 776.714 352.033 720.837 364.053 742.205 380.023 852.958 366.067 792.668 330.067 789.995 348.058 804.267 344.083 804.267 344.083 830.057 397.989 Compound 1 2 3 4 5 6 7 8 9 10 11 12 13 14 15 16 17 18 19 20 21 22 23 24 25 26 27 28 29 HOMO (eV) -9.26 -9.43 -9.28 -9.29 -9.12 -9.08 -9.19 -9.23 -9.23 -9.23 -9.36 -9.31 -9.24 -9.59 -9.34 -9.07 -9.01 -8.98 -9.44 -9.35 -9.48 -9.11 -8.96 -9.16 -9.03 -9.09 -8.96 -8.92 -9.19 PSA 83.7 83.7 83.7 83.7 83.7 83.7 106.6 106.6 106.6 106.6 106.6 106.6 106.6 106.6 106.6 106.6 106.6 120.7 152.7 152.7 106.6 120.7 120.7 106.6 106.6 106.6 106.6 106.6 106.6 Interpretation of Model 3 This model establishes the correlation between Mass of the compound, Polar Surface Area (PSA), HOMO (Highest Occupied Molecular Orbital) energy, Boiling point of the compound and COX-2 inhibitory activity. The polar surface area (PSA) of a molecule is defined as the surface area of nitrogen and oxygen atoms in a molecule in addition to the surface of the hydrogens attached to these hetero atoms. Negative correlation suggests that as the polar surface area increases COX-2 inhibitory activity decreases, as it could be the surface polarity of molecule causing hindrance to the binding of the molecule at active site. HOMO is an electronic parameter and is the highest energy level in the molecule that contains electrons. It is important in governing the molecular reactivity and properties. When a molecule acts as an electron pair donor, electrons from its HOMO are supplied [5]. This term indicates the importance of electrostatic interactions of ligand with enzyme. Positive correlation of HOMO with COX-2 inhibitory activity indicates that increase in the electron energy of the molecule increases COX-2 activity. Mass of the compound is a steric descriptor 166
Jignasa K. Savjani et al J. Chem. Pharm. Res., 2011, 3(1):160-168 ______________________________________________________________________________ and is positively correlated with COX-2 inhibitory activity. The descriptor represents the importance of size of the molecule to bind tightly with the enzyme during interactions. Table 6. Observed and predicted activities of 3, 4-Diaryloxazolones Observed activity pIC50 1 -0.20 2 0.18 3 0.29 4 0.49 5 0.32 6 0.16 7 -0.13 8 -0.38 9 -0.34 10 -0.18 11 -0.81 12 -0.18 13 -0.08 14 -0.30 15 -0.99 16 0.10 17 -0.19 18 0.68 19 -2.00 20 -1.77 21 -0.36 22 -0.05 23 0.11 24 -0.67 25 -0.26 26 0.29 27 0.03 28 -0.23 29 0.64 Positively correlated Mass underlines the importance of steric factor of the molecules for increasing the COX-2 inhibitory activity as the smaller valine side chain in COX-2 provides the selective inhibitors get greater access to the side pocket. So, as the bulk of the molecule increases it leads to greater access for COX-2 than COX-1. In accordance with the published literature (Puig et al., 2000), in the sulfone series, the introduction of 4-trifluoromethyl resulted in a complete loss of COX-1 activity while maintaining the COX-2 potency; our findings suggest that these could be attributed to the bulk of the substituent. Boiling point is a thermodynamic descriptor and is negatively correlated with COX-2 inhibitory activity. Results suggest that increase in the bulk of the molecule and lipophilicity would be helpful in increasing COX-2 inhibitory potency. Predicted activity pIC50 0.07 0.07 0.26 0.29 0.33 0.46 -0.48 -0.32 -0.32 -0.32 -0.44 -0.38 -0.29 -0.26 -0.60 -0.25 -0.09 0.20 -1.92 -1.80 -0.42 0.26 0.49 -0.36 -0.18 -0.05 -0.02 0.04 0.12 Compound No. 167
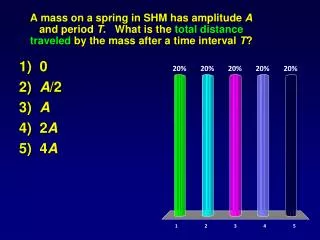
Jignasa K. Savjani et al J. Chem. Pharm. Res., 2011, 3(1):160-168 ______________________________________________________________________________ Plot of Observed and Predicted Activity 5.00 4.00 3.00 2.00 Predicted Activity 1.00 0.00 -2.00 -1.00 0.00 1.00 2.00 -1.00 -2.00 -3.00 -4.00 -5.00 Observed Activity Fig. (2). Scatter plot of observed and predicted COX-2 inhibitory activity of 3, 4-diaryl oxazolones. The QSAR analysis resulted in statistically significant quantitative model with good predictive ability. It was observed from the generated QSAR model that COX-2 inhibitory activity of 3, 4- Diaryloxazolones is governed by electronic (HOMO), thermodynamic (B.P) and steric (PSA, Mass) features of the molecule. The results obtained from the QSAR study emphasize the utility of the QSAR analysis and molecular modeling studies to optimize the design of potent COX-2 inhibitor molecules. REFERENCES [1]D Gerd; K Werner. Eur. J. Med. Chem., 2001, 36, 109-26. [2]H Hashimoto; K Inamura; J Haruta. J. Med. Chem., 2002, 45(7), 1511-7. [3]A Jamloki; C Karthikeyan; SK Sharma; NS Hariarayan Moorthy; P Tivedi. Asian J. of Biochem., 2006, 13, 236-243. [4]C Puig; IC Crespo; N Godessart; J Feixas; J Ibarzo; JM Jimenez; I Cardelus; A Heredia; M Miralpeix; J Puig; J Beleta; JM Huerta; M Lopez; V Segarra; H Ryder; JM Palacios. J. Med. Chem., 2000, 43, 214-223. [5]S Vadlamudi; V Kulkarni. InternetElectronic Journal of Molecular Design,2003, 2. 168