Download
1 / 6
60 likes | 69 Vues
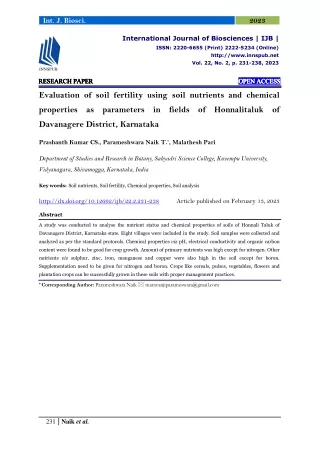
Ninety six surface soil samples representing twenty villages of the recently tsunami affected areas of Nagapattinam taluk of Tamilnadu in India were analyzed for the basic soil parameters<br>viz., pH, EC, OC and OM and macronutrients viz., N, P, K by using standard methods. The available micronutrients (DTPA extractable) viz., Fe, Mn, Cu and Zn were investigated by using Atomic Absorption Spectrophotometer (ECIL, AAS-4129). The availability of macro and micronutrients and their relationship with soil properties were also studied. The result showed that the available macronutrients N, P, K was 86.5% low and 13.5% medium for N, 100% low for P and 100% medium for K respectively. Regarding the micronutrients, Fe was found to be sufficient by 97% and Mn deficient by 100%, Zn was found to be sufficient by 53% and Cu deficient by 45% respectively. Further, Fe showed positive correlation with OC but negative correlation with pH. Mn also followed the same trend as that of Fe with OC, EC and pH. Cu showed positive correlation with EC and negative correlation with pH and OC. Zn showed negative correlation with OC and positive orrelation with EC and pH. <br>

E N D
Available on line www.jocpr.com Journal of Chemical and Pharmaceutical Research __________________________________________________ J. Chem. Pharm. Res., 2011, 3(3):87-92 ISSN No: 0975-7384 CODEN(USA): JCPRC5 Nutrients strength and their relationship with soil properties of natural disaster proned coastal soils *1Vijayakumar.R, 2Arokiaraj.A and 3Martin Deva Prasath.P *1Department of Engineering, Manipal University, Dubai, UAE. 2Department of Chemistry, AVC Mayiladuthurai, India 3PG & Research Department of Chemistry, TBML College, Porayar, India ______________________________________________________________________________ ABSTRACT Ninety six surface soil samples representing twenty villages of the recently tsunami affected areas of Nagapattinam taluk of Tamilnadu in India were analyzed for the basic soil parameters viz., pH, EC, OC and OM and macronutrients viz., N, P, K by using standard methods. The available micronutrients (DTPA extractable) viz., Fe, Mn, Cu and Zn were investigated by using Atomic Absorption Spectrophotometer (ECIL, AAS-4129). The availability of macro and micronutrients and their relationship with soil properties were also studied. The result showed that the available macronutrients N, P, K was 86.5% low and 13.5% medium for N, 100% low for P and 100% medium for K respectively. Regarding the micronutrients, Fe was found to be sufficient by 97% and Mn deficient by 100%, Zn was found to be sufficient by 53% and Cu deficient by 45% respectively. Further, Fe showed positive correlation with OC but negative correlation with pH. Mn also followed the same trend as that of Fe with OC, EC and pH. Cu showed positive correlation with EC and negative correlation with pH and OC. Zn showed negative correlation with OC and positive correlation with EC and pH. Key words: DTPA-extractable, pH, micronutrients, soil properties, tsunami. ______________________________________________________________________________ INTRODUCTION Soil fertility is one of the important factors controlling yields of the crops. Soil characterization in relation to evaluation of fertility status of the soils of an area or region is an important aspect in context of sustainable agriculture production. Because of imbalanced and inadequate fertilizer use coupled with low efficiency of other inputs, the response (production) efficiency of chemical fertilizer nutrients has declined tremendously under intensive agriculture in recent years. 87
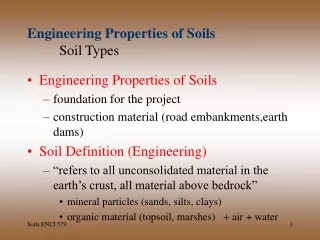
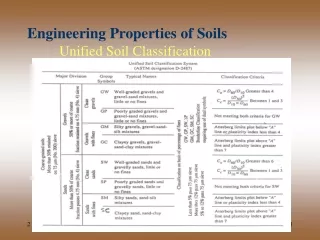
Vijayakumar.R et al J. Chem. Pharm. Res., 2011, 3(3):87-92 ______________________________________________________________________________ Introduction of high yielding varieties (HYV) in Indian Agriculture in mid- sixties compelled the farmers to use high doses of NPK fertilizers along with micronutrient fertilizers. Micronutrient plays a vital role in maintaining soil health and also productivity of crops. These are needed in very small amounts. The soil must supply micronutrients for desired growth of plants and synthesis of human food. Increased removal of micronutrients as a consequence of adaption of HYVs and intensive cropping together with shift towards high analysis NPK fertilizers has caused decline in the level of micronutrients in the soil to below normal at which productivity of crops cannot be sustained. The deficiencies of micronutrients have become major constraints to productivity, stability and sustainability of soils. Soils with finer particles and with higher organic matter can generally provide a greater reserve of these elements whereas, coarse textured soils such as, sand have fewer reserves and tend to get depleted rather quickly. The widespread need for the micronutrients observed in recent years can be accounted for in three ways viz. i) Naturally deficient in some soil types ii) their deficiency has been brought out by crop removal and iii) widespread erosion together with destruction of soil organic matter has also brought about their removal from the soil. Considering all the above facts a study was made in Nagapattinam taluk in Nagapattinam district of Tamil nadu which was recently affected by the tsunami of December 2004 in India. Further Nagapattinam district is often affected by natural disasters like cyclones, floods, storm etc. It is well known that the soil series of Nagapattinam taluk are characterized by light in texture, moderate to high pH and low to medium in organic content. Hence an attempt has been made to analyze the basic soil parameters, macronutrients and the micronutrients of Nagapattinam taluk of Nagapattinam district. Soil series and Characteristics It was found that there are 8 soil series in Nagapattinam taluk. The name of the 8 soil series and its characteristics are mentioned below: 1) Adhanur(And) - Adhanur series comprises of dark grey brown to dark yellowish brown, loamy textured soils derived from Cauvery alluvium. The soils are very deep, non-calcareous, having sand layer within 100 cm. 2)Kalathur(Klt) - Dark grey (10 YR 4/1m); clay; strong coarse sub angular blocky; very hard firm sticky and plastic; brownish yellow root hair mottling; many fine to medium roots; slow permeability; gradual smooth boundary; pH 7.4; 3)Kohur(khr) - Very dark grey brown (10 YR 4/3 m); silty loam; medium moderate angular blocky; hard firm slightly sticky and plastic; slow permeability; cracks present; common fine brown mottlings; slightly saline; many fine roots; few fine pores; clear smooth boundary; pH 7.1; 4)Kivalur(kvr) - Dark yellowish brown (10 YR 4/4 m); silty clay; coarse strong sub angular blocky; hard firm sticky and slightly plastic; many fine to medium roots; many very fine tubular pores; slow permeability; deep crack; clear smooth boundary; pH 6.9; 5)Sikar(Skr) - Very dark greyish brown (10 YR 3/2 m); silty clay, coarse strong sub angular blocky; very hard firm sticky and plastic; few fine pores; many fine roots; moderately slow permeability; clear smooth boundary; pH 7.8; 6) Padugai(Pdg) - Brown (10 YR 4/3 m); sandy clay loam; moderate sub angular blocky; friable slightly sticky and nonplastic; faint common medium black mottling; many fine to medium 88
Vijayakumar.R et al J. Chem. Pharm. Res., 2011, 3(3):87-92 ______________________________________________________________________________ roots; common very fine random tubular pores; moderate permeability; abrupt smooth boundary; pH 6.8; 7) Sethi(Sth) - Grey(10 YR 6/1m); sand; structure less single grained; loose very friable nonsticky nonplastic; very rapid permeability; common fine roots; diffused smooth boundary; pH 7.7; 8) Nagapattinam(Ngp) - Very dark grey brown (10 YR 3/2 m); clay; coarse strong angular blocky; hard firm sticky and plastic; very slow permeability; deep crack; many fine roots; fine few pores; slightly saline; few fine yellow and brown mottling; clear irregular boundary; pH 7.1. Table 1: Name of the villages and number on the map. S.No Name of the Village No.on the Map S.No Name of the Village No.on the Map 1. Ervadi 53 2 Marungur 117 3 Nagapattinam 5 4 Thuraiyur 119 5 Vadakarai 87 6 Oratthur 17 7 Puducheri 15 8 Sembiyanmadevi 27 9 Sikkal 12 10 Themangalam 1 11 12 13 14 15 16 17 18 19 20 Therkupoigainallur Thirukkanapuram Uthamacholapuram Vazhakudi Kattumavadi Kurichi Palaiyur Pappakoil Thenkarai Vadugacheery 20 92 123 106 63 22 6 11 94 25 89
Vijayakumar.R et al J. Chem. Pharm. Res., 2011, 3(3):87-92 ______________________________________________________________________________ Study area Nagapattinam soil series comes under Agro climatic zone, Sub-zone IV – Cauvery Delta zone. Coastal eco system – Eastern coastal plain hot sub humid to semi-arid eco system with a growing period 90 – 210+ days. Nagapattinam taluk is one of the 8 taluks of Nagapattinam District of Tamilnadu that lies between Lat. 110 3’ N; Long 790 50’E, surrounded by Karaikal, Nannilum, Thiruvarur, Kivelur and Bay of Bengal. It covers an extant of 31181 ha land area. The sites from where soil samples were collected are depicted in Map 1, for which an inventory survey of the area was conducted. EXPERIMENTAL SECTION Soil samples (0-15 cm) were collected from 96 sites (map.1) covering 20 revenue villages, keeping in view the physiographic characteristic in different cross sections of the area as well as variation in soil texture. Soils were completely air-dried and passed through 2mm sieve and stored in properly labeled plastic bags for analysis. The list of villages of sampling sites of Nagapattinam Taluk soils are highlighted in the given Map1and the names of the sampling stations are given in Table 1. The processed soil samples were analyzed for basic soil parameters ( pH, EC, OC and OM) and for macronutrients (N,P,K) by using standard procedures (Jackson4 1973). The available Fe, Mn, Cu and Zn in soil samples were extracted with a DTPA solution (0.005M DTPA + 0.01 M CaCl2 + 0.1M triethanolamine, pH 7.3 as outlined by Lindsay and Norvell11 (1978). The concentration of micronutrients in the extract was determined by atomic absorption spectrophotometer (ECIL, AAS-4129). RESULTS AND DISCUSSION The results of all the relevant soil characteristics are described in table2. The soils are neutral to alkaline in reaction, pH 7.32 – 8.75 with the mean value of pH 7.9. The relative high pH of the soils might be due to the presence of high degree of base saturation. The electrical conductivity (EC), organic carbon (OC), organic mineral (OM) of the soil varied from 0.09 – 0.62 dsm-1, 0.20 – 0.42% and 0.41- 0.84% with a mean value of 0.331dsm-1, 0.29% and 0.60% respectively (Table .2). It showed a considerable variation with types and topography of soils. On the basis of the limits suggested by Muhr3 for judging salt problems of soils, all samples (100%) were found normal (< 1.0) in EC. The organic carbon was very low (<0.50%) in 100% soil samples (table.2). The very low OC content of these soils may be attributed to the poor vegetation and high rate of organic matter decomposition under hyper-thermic temperature regime which leads to extremely high oxidizing conditions (Kameriya7 1995). The results of the present investigation are in close proximity with the findings of singh et al 1(1997). Available nitrogen content varied from 127.95 – 283.556 kg.ha-1 with an average value of 189.72kg.ha-1. On the basis of standard ratings (F.A.Q. Calcareous soils2 1973), 86.5% samples were low (< 250 N kg.ha-1) and 13.5% samples were medium (250- 500kg.ha-1) in available nitrogen (Table 2). Similar results were reported by paliwal5. The available phosphorus content varied from 2.47 – 17.78 kg.ha-1 with the mean value of 13.18 kg.ha-1 (table 2). The range is considerably large which might be due to variation in soil properties viz., pH, organic matter content, texture and various management and agronomic 90
Vijayakumar.R et al J. Chem. Pharm. Res., 2011, 3(3):87-92 ______________________________________________________________________________ practices. On the basis of the limits suggested by Muhr3, all the 100% samples were low (< 20 P2O5 kg.ha-1, Table 2). This might be due to the presence of more than 50% of phosphorus in organic farms and after decomposition of organic matter as humus is farmed which forms complex with Al and Fe and that is a protective cover for phosphorus fixation with Al and Fe. Thus reduce phosphorus adsorption / phosphate fixation, (Tisdale S.L et. Al101997). Status of available potassium (K2O) in the soils ranged from 140.79 – 284.05 kg.ha-1 with an average of 162.699 kg.ha-1 (Table .2). According to Muhr3 100% samples were medium (125- 300 kg.ha -1) in potassium content (Table 2). This might be due to creation of favourable soil environment with the presence of high organic matter. Data on available Fe in soil samples indicated that 3% soil samples were deficient in DTPA-Fe content and 97% of the soil samples were sufficient (Table 2) with 4.5mg kg-1 as the critical limit proposed by Lindsay and Norvell11. The content of DTPA- Fe in soils varied from 4.1 to 6.72mg kg-1 with an average value of 5.72mg kg-1 (Table . 2). The available of Fe increased significantly with an increase in EC (r = 0.66), organic carbon (r = 0.42) whereas the same decreased with increase in pH (r = -1.10) (Table. 3). The DTPA-Mn in the soil samples varied from 2.04 to 2.72mg kg-1 with the mean value of 2.36 (Table .2), considering 3.00 mg kg-1 as critical limit for Mn deficiency (Sakal et al9 1985), here all the 100% samples were deficient in availability (Table.2). The available Mn in these soil samples was positively correlated with EC (r = 0.02), remaining same with organic carbon and inversely proportional to pH by -0.17 (Table. 3). Available Cu content of the soil samples varied from 0.20 – 1.15mg.kg-1 with the mean value of 0.708mg.kg-1 (Table. 2). The data indicated that 45% of the soil samples were deficient in availability of Cu and 55% were sufficient (Table.2) considering 0.66 mg kg-1(sakal et al9 1985). The available Cu inversely proportional to pH (r = - 0.47), OC (r = - 0.06) and directly proportional to EC (r=0.24), (Table. 3). Table 2. Physico – chemical properties and Nutrient Status of Soil Characteristics pH EC OC OM Available Macronutrients Range (kg.ha-1) N 127.95-83.556 189.72 P 2.47-17.78 K 140.79-284.05 162.699 Available Micronutrients’ (mg.kg-1) Fe 4.1-6.72 Mn 2.04-2.72 Cu 0.20-1.15 Zn 0.28- 0.90 Available Zn in the soil samples varied from 0.28 to 0.90 mg kg-1 with the mean value of 0.58mg.kg-1 (Table.2). On the basis of critical limit suggested by Takkar and Mann6 47% samples were deficient, 53% samples were marginal and none of the samples were sufficient Range 7.32 -8.75 0.09-0.62dsm-1 0.20-0.42% 0.41-0.84% Mean (kg.ha-1) Mean 7.9 0.331dsm-1 0.29% 0.60% Medium (%) 13.5 nil 100 Marginal (%) nil nil nil 53 Low (%) 86.5 100 nil Deficient (%) 3 100 45 47 High (%) nil nil nil Sufficient (%) 97 nil 55 nil 13.18 Range Mean (mg.kg-1) 5.72 2.36 0.708 0.58 91
Vijayakumar.R et al J. Chem. Pharm. Res., 2011, 3(3):87-92 ______________________________________________________________________________ (Table.2) in availability (< 0.6 mg.kg-1 for deficient, 0.6 to 1.2mg.kg-1 for marginal and > 1.2 mg.kg-1 for sufficient). The availability of Zn increased with increase in EC (r = 0.2), pH (r = 0.3) whereas reduced with increase in organic carbon (r = - 0.033), (Table. 3). Table 3. Correlation matrix between soil properties and available nutrients Soil Characteristics Fe Mn Cu OC 0.42 same -0.06 pH -1.10 -0.17 EC 0.66 0.02 CONCLUSION Considering the critical limit of macronutrients, the recorded macronutrients are 86.5% low, 13.5% medium in nitrogen, 100% low in P2O5 and 100% medium in potassium. Among micronutrients, Fe sufficient by 97%, Mn deficient by 100%, Zn sufficient by 53% and Cu deficient by 45%. The studied soils though contained adequate amounts of available micronutrients deficiencies also recorded. The results indicated that the soil properties pH, EC and OC as the main characteristics playing major role in controlling the availability of micronutrients. These factors could be manipulated in order to combat any present or future deficiencies of micronutrients in these soils. REFERENCS [1]CP Singh, SP Gupta and VK Gupta, Hariyana Journal of Horticulture science, 1997, 26, 199-202. [2]FAO Calcareous Soils, FAO Soils Bulletin No. 21, 1973 [3]GR Muhr, NP Datta, N Shankara Subraney, F Dever, VK Lecy, and RR Donahue, Soil testing of India. USAID Mission to India, 1963. [4]ML Jackson, Soil chemical analysis, prentice Hal of India Private Limited, New Delhi, 1973. [5]ML Paliwal, Studies on Major and Micronutrient Status of Soils of Panchayat Samiti Bhinder (Dist.Udaipur), M.Sc(Ag)Thesis, Rajasthan Agricultural University, Bikaner (1996). [6]PN Takkar and MS Mann, Agrochemica, 1975, 19, 420 [7]PR Kameriya, Characterization of soils of agro climatic zone of transitional plain of inland drainage (Zone 11-A) of Rajasthan, Ph.D. Thesis, R.A.U., Bikaner, 1995. [8]RL Yadav and MC Meena, Journal of the Indian Society of soil science, 2009 Vol. 57, No.1, pp 90-92. [9]R Sakal, AP Singh, BP Singh, RB Sinha, SN Jha, and SP Singh, Journal of the Indian Society of soil science, 1985; 33, 672-675. [10]SL Tisdale, WL Nelson, JD Beaton, JL Havlin, Soil fertility and fertilizers, 5th Edition. Macmillan publishing Co., New Delhi, 1997, pp 144, 180, 198, 201. [11]WL Lindsay and WA Norvell, Development of DTPA soil tests for Zn, Fe, Mn and Cu. Soil Science Society of America Journal 1978; 42, 421-428. Available Micronutrients Zn -0.033 0.3 0.2 -0.47 0.24 92