Download
1 / 7
70 likes | 83 Vues
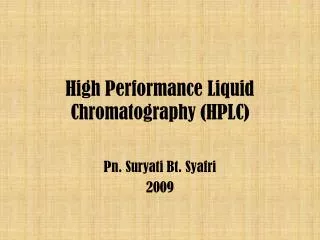
A rapid and sensitive HPLC method with UV detection (206 nm) for routine analysis of alpha amyrin from Scoparia<br>dulcis plant extract was developed. Chromatography was performed with mobile phase containing a mixture of<br>acetonitrile and water (59:41) with a flow rate of 1.5 mL min-1. The procedure was validated by linearity<br>(correlation coefficient = 0.9997), accuracy, robustness and intermediate precision. Limit of quantitation and Limit<br>of detection were found to be 1.2 µg and 0.4 µg respectively; this indicates the method is highly sensitive. Linearity<br>was established by analyzing different concentration levels of alpha amyrin ranging from 0.008mg mL-1 to 0.032 mg<br>mL-<br>. For method precision the percent relative standard deviation was 2.96 and for intermediate precision it was<br>2.05 (n=6) value indicated a good precision of the analytical method.

E N D
Available online at www.derpharmachemica.com Scholars Research Library Der Pharma Chemica, 2013, 5(6):234-240 (http://derpharmachemica.com/archive.html) ISSN 0975-413X CODEN (USA): PCHHAX Quantitation of alpha amyrin in Scoparia dulcis L. whole plant powder by high performance liquid chromatography Naresh Kumar Kataria,M. Venkatanarayana, Parag Deodharb,Chandra Sekhar Ch.b and Ramya Billurc aDepartment of Chemistry, GITAM University, HTP Campus, Hyderabad, India bDepartment of Chemistry University College of Engineering, JNT University Kakinada, Kakinada(A.P), India cDepartment of Chemistry, University of Louisville, Kentucky, USA _____________________________________________________________________________________________ ABSTRACT A rapid and sensitive HPLC method with UV detection (206 nm) for routine analysis of alpha amyrin from Scoparia dulcis plant extract was developed. Chromatography was performed with mobile phase containing a mixture of acetonitrile and water (59:41) with a flow rate of 1.5 mL min-1. The procedure was validated by linearity (correlation coefficient = 0.9997), accuracy, robustness and intermediate precision. Limit of quantitation and Limit of detection were found to be 1.2 µg and 0.4 µg respectively; this indicates the method is highly sensitive. Linearity was established by analyzing different concentration levels of alpha amyrin ranging from 0.008mg mL-1 to 0.032 mg mL-. For method precision the percent relative standard deviation was 2.96 and for intermediate precision it was 2.05 (n=6) value indicated a good precision of the analytical method. The proposed method was simple, highly sensitive, precise, accurate indicating that the method is useful for routine quality control analysis of Scoparia dulcis Linn. whole plant powder and quantitative determination of alpha amyrin. Keywords: Scoparia dulcis, Alpha amyrin, HPLC, Method validation. _____________________________________________________________________________________________ INTRODUCTION Alpha amyrin is a potential anti arthritic agent [1] having a chemical name (3β)-Urs-12-ene-3 ol; α-amyrenol Alpha amyrin is triterpene having an empirical formula C30H50O, a molecular weight of 426.73 and have structural formula of (Fig. 1). Alpha amyrin has the inhibitory activity against lipoxygenase enzyme [2] and the antinociceptive properties of alpha amyrin were reported [3]. Scoparia dulcis Linn (Family. Scrophulariaceae) commonly known as “Vassorinha” grows widely in open places through India, Brazil, China, Japan, and Taiwan. The plant aerial parts were traditionally used for the medicinal purpose. The literature survey reveals the pharmacological importance of the plant and the plant extracts have been reported to demonstrate antiviral activity in rats in addition to anti diarrhoeal activity and anti spasmodic activities [4]. In traditional medicine the plant powder has been used in the treatment of bronchitis, fever and kidney disorders [5- 7]. The plant is also used as sweet broom and it is recognized by the Indian System of Medicine. Three chemotypes of plants have been identified based on the predominant type of diterpene produced in the plant [8-10]. This paper reports a rapid and sensitive HPLC determination method with UV detection, useful for the routine quality control of alpha amyrin in plant extracts. The method was validated by parameters such as linearity, accuracy, precision etc. 234 www.scholarsresearchlibrary.com
Naresh Kumar Katari et al _____________________________________________________________________________ Der Pharma Chemica, 2013, 5 (6):234-240 The same experimental conditions enable the quantitation of alpha amyrin in plant extracts and thereby enabling the confirmation of the label claim of alpha amyrin containing products. MATERIALS AND METHODS 2.1. Chemicals and reagents Standard alpha amyrin was obtained from Sigma Aldrich (USA). HPLC grade acetonitrile was obtained from Merck India. Ultra pure water was obtained using a Milli-Q UF-Plus apparatus (Millipore, MA, USA) was used to prepare all solutions for the method. All other chemicals used were of analytical grade unless otherwise stated. 2.2. Apparatus and chromatographic conditions Hitachi L-2130, series chromatographic apparatus was used for this work. Data was collected and processed with Ezechrome Elite workstation. The HPLC system was equipped with an injection valve (Autosampler-L-2200), pumping system (VWR Hitachi pump L-2130) and with L-2400 UV dual λ absorbance detector. Chromatographic separation was performed on an Inertsil (phenyl) column (250 mm x 46 mm, 5 µm). The mobile phase comprising a mixture of acetonitrile and water (59:41) was delivered at a flow rate of 1.5 mL min-1. The mobile phase is filtered through 0.45 µm filter (Pall Life Sciences) and degassed. Chromatography was performed at ambient temperature and detection was made at 206 nm. The injected volume was 20 µL. 2.3. Preparation of standard solution A stock solution of standard alpha amyrin was prepared in mobile phase. The prepared stock solution was diluted with mobile phase to give a solution containing alpha amyrin in the concentration of 20 µg. 2.4. Preparation of plant extract The plant of Scoparia dulcis was collected from the surroundings of Visakhapatnam and Bhubaneswar. The whole plant collected, was dried at room temperature and then ground to fine powder, which was passed through an ASTM BSS 85 mesh. 10 gm of plant powder was taken in a flask, 100 mL of methanol was added and kept on shaker for 2 hr. After shaking, the flask was left overnight at room temperature. The contents of the flask were filtered through a Whatman No. 1 filter paper. The resultant filtrate was passed through 0.45 µ filter and sealed to prevent loss of methanol. RESULTS AND DISCUSSION The applied chromatographic conditions permitted a good separation of alpha amyrin in the plant extract, no decomposition of alpha amyrin was observed during the analysis. The HPLC method was validated for the parameters reported below. 3.1. System suitability The chromatographic separation was carried out by injecting standard solution five times, the peak area was considered, for five replicates the percent relative standard deviation was found to be less than 2.0. As explained above was carried out with HPLC to evaluate the chromatographic parameters (asymmetry 1. 2 to 1. 4 and theoritical plates 6000 to 8500). Figures 2 and 3 represent the chromatograms of the standard and sample (plant extract), which corresponds to the chromatographic separation of the compound. The system suitability test was performed by injecting a standard alpha amyrin five times. The % Relative Standard Deviation was found to be less than 2.0. It was concluded that the developed method is the optimum according to the studied parameters. Therefore this method can be applied to its intended purpose with no problems, its suitability being proved. 3.2. Specificity Under the same chromatographic condition blank methanol was injected standard was injected, the peak purity of Alpha amyrin was studied by using PDA detector and found to be homogenious at set condition at peak coverage 95% the peak purity obtained was 0.999 for both standard as well as sample. The U.V spectrum of sample and standard are same.No placebo studies performed as we all know well it was plant powder sample. Reproducable results were observed 235 www.scholarsresearchlibrary.com
Naresh Kumar Katari et al _____________________________________________________________________________ Der Pharma Chemica, 2013, 5 (6):234-240 3.3. Stability of the solution The experiment was conducted for 74 hr with the standard and sample solutions injected at hours 0, 2, 4, 8, 12, 24, 36, 48 and 72hr. The solutions of the standard and sample were found to be stable up to 72 hr at auto sampler chiller temperature configured at 250C. The area percent difference with initial and 72 hr standard and sample solutions was found to be 98.9% and 98.1% respectively. 3.4. Linearity Linearity was evaluated by different concentrations of standard solutions chromatographed using the methanol, analyzing each concentration twice. The peak area and concentration was subjected to least square linear regression analysis to calculate the correlation coefficients. The linearity of peak area responses versus concentrations was observed with in the range of 0.008 mg mL-1 to 0.032 mg mL-1 (r = 0.9997, n = 7). The linear response was observed over the examined concentration range. The results were tabulated table 1. 3.5. Accuracy and repeatability Accuracy of the method was established by means of a recovery experiment. Accuracy was studied using three different solutions containing 120, 140 and 160% of Alpha amyrin in the whole plant powder (the external standard addition technique). The recovery data was reported in table 5. The obtained values were within the range of 100.56 to 102.33 %, which indicates the accuracy of the method. The system repeatability was calculated from seven replicate analysis and the low coefficient of variation values are indicative of precision of the method. 3.6. Robustness The robustness of the method was studied, on the wavelength + 2 nanometer and flow rate + 0.2 ml/min during the study, where a slight variation in the retention time of alpha amyrin was observed but the percent assay in both the cases was found to be more or less the same indicating the robustness of the method. 3.7. Precision The intermediate precision is a method of precision between repeatability and reproducibility and it should be established according to the circumstances under which the procedure was intended to be used [11]. The precision is usually expressed as variance, relative standard deviation or coefficient of variation of a series of measurements [12]. Method precision was carried out in one day at same experimental conditions using six different samples of assay concentration alpha amyrin with two repetitions each. The mean, standard deviation and coefficient of variation (RSD = 2.97%) were tabulated (Table.3). The low values of the coefficient of variation are indicative of the precision of the method. The intermediate precision was obtained when the assay is performed by multiple analysts, using multiple instruments, on multiple days, in one laboratory [11]. In order to study these effects simultaneously, a multivariate approach was used. The considered variables include analysts (1 and 2) and days (1 and 2). Each experiment was repeated three times in order to estimate the experimental error variance. The analysis was carried out in a randomized order according to the experimental plan reported (table 4). The content of alpha amyrin obtained were comparable to that of the method precision results. The percent relative standard deviation found was 2.05, indicating a good precision of the analytical procedure. 3.8. Limit of quantitation Limit of quantitation and limit of detection of HPLC method for alpha amyrin in standard solution was established at a signal/noise (S/N) ratio of 10 and 3 respectively, which were experimentally verified by nine injections. The experiment was carried out up to 72 hr with the standard and sample solutions injected at 0, 2, 4, 8, 12, 24, 36, 48 and 72 hr. the solutions of the standard and sample were found to be stable up to 72 hr at auto sampler chiller temperature configured at 250C. The area percent difference with initial and 72 hr for standard and sample was found to be 98.9% and 98.1% respectively, which indicate the sensitivity of the method. The limit of detection and limit of quantitation for alpha amyrin was found to be 0.4 µg mL-1 and 1.2 µg mL-1 respectively. 236 www.scholarsresearchlibrary.com
Naresh Kumar Katari et al _____________________________________________________________________________ Der Pharma Chemica, 2013, 5 (6):234-240 Fig. 1.Chemical Structure of Alpha amyrin CH3 CH3 CH3 CH3 CH3 H OH CH3 H CH3 CH3 Fig. 2. Chromatogram of Standard Alpha amyrin 400 400 200 200 Alpha Amyrin mAU mAU 0 0 0 5 10 15 20 25 30 35 40 Minutes Fig. 3. Chromatogram of alpha amyrin in plant extract 400 400 Alpha Amyrin 200 200 mAU mAU 0 0 0 5 10 15 20 25 30 35 40 Minutes 237 www.scholarsresearchlibrary.com
Naresh Kumar Katari et al _____________________________________________________________________________ Der Pharma Chemica, 2013, 5 (6):234-240 Table 1. Results of the data analysis for the quantitative determination of Alpha amyrin by the proposed method.(Linearity results) Parameter Intercept Standard error of y estimate r (Regression coefficient) Number of observations Degrees of freedom x coefficient (slope) Standard error of coefficient Limit of detection (LOD), µg mL-1 Limit of quantitation (LOQ), µg mL-1 Table 2 Results from recovery experiment Value -8868.42 4912.15 0.9997 7 5 33936303.60 232077.55 0.4 1.2 % of Alpha amyrin Powder taken Std added ml stock 0.0 0.0 0.0 1.0 1.0 1.0 2.0 2.0 2.0 3.0 3.0 3.0 Rep-1 Rep-2 Mean Found (mg) %Recovery Mean recovery (mg) 10002.3 10003.5 10008.6 10003.6 10008.5 10003.8 10009.3 10004.5 10005.8 10005.3 10000.5 10008.8 I II III I II III I II III I II III 853853 853965 853909 866328 862526 864427 862536 872645 867591 1025695 1024690 1025193 1034791 1044685 1039738 1028780 1025680 1027230 1195473 1160378 1177926 1186378 1193586 1189982 1189453 1191591 1190522 1366255 1358296 1362276 1356284 1366578 1361431 1378652 1376385 1377519 0.64 0.64 0.65 0.76 0.77 0.76 0.88 0.89 0.89 1.01 1.01 1.03 101.4 102.6 103.0 121.7 123.4 122.0 139.8 141.3 141.3 161.7 161.7 163.5 100% 120% 140% 160% 102.33 122.36 140.79 162.29 Table 3 Results from Method precision Method Precision Peak Area Rep-1 Rep-2 858659 859645 859152 815698 821542 818620 834152 834523 834338 845689 839854 842772 851235 854535 852885 791562 792846 792204 S.D: Standard Deviation %R.S.D: Relative Standard Deviation Sample No Quantity of powder (mg) Volume (ml) Alpha amyrin found (mg) %Alpha amyrin present Avg 1 2 3 4 5 6 10002.5 10005.8 10002.9 10005.6 10003.8 10004.5 100 100 100 100 100 100 5.28 5.03 5.13 5.18 5.24 4.87 5.12 0.15 2.96 0.053 0.050 0.051 0.052 0.052 0.049 0.05 0.002 2.97 Mean SD %RSD Table 4 Results from Intermediate precision Intermediate Precision\different day Peak Area Rep-1 Rep-2 100 823456 835468 829462 100 859235 861243 860239 100 862358 859241 860800 100 856234 852645 854440 100 852365 849562 850964 100 814278 823568 818923 S.D: Standard Deviation %R.S.D: Relative Standard Deviation Sample No Quantity of powder (mg) Volume (ml) Alpha amyrin found (mg) %Alpha amyrin present Avg 1 2 3 4 5 6 10000.5 10008.8 10004.9 10001.6 10005.8 10002.5 4.99 5.17 5.17 5.14 5.11 4.92 5.08 0.10 2.06 0.050 0.052 0.052 0.051 0.051 0.049 0.05 0.001 2.05 Mean SD %RSD 238 www.scholarsresearchlibrary.com
Naresh Kumar Katari et al _____________________________________________________________________________ Der Pharma Chemica, 2013, 5 (6):234-240 Table 5 Results for Comparison Comparison for Method precision and intermediate Method precision spl-1 Method precision spl-2 Method precision spl-3 Method precision spl-4 Method precision spl-5 Method precision spl-6 Intermediate precision spl-1 Intermediate precision spl-2 Intermediate precision spl-3 Intermediate precision spl-4 Intermediate precision spl-5 Intermediate precision spl-6 Mean S.D %RSD Table 6 Results from assay experiment Assay Experiment\Different instrument Peak Area 1 2 100 1935265 1935893 1935581 100 1952635 1962315 1957475 100 1942358 1945623 1943990 100 1882633 1896251 1889442 100 1923523 1915236 1919380 100 1953261 1942365 1947813 100 1942315 1912356 1927336 CONCLUSION 5.28 5.03 5.13 5.18 5.24 4.87 4.99 5.17 5.17 5.14 5.11 4.92 5.10 0.13 2.47 Sample No Quantity of powder (mg) Volume (ml) Alpha amyrin found (mg) %Alpha amyrin present Average 1 2 3 4 5 6 7 10008.2 10005.6 10008.5 10001.5 10004.2 10006.8 10001.2 5.26 5.32 5.28 5.13 5.21 5.29 5.24 5.25 0.006 1.14 0.0526 0.0532 0.0528 0.0513 0.0521 0.0529 0.0524 Mean SD %RSD The proposed high-performance liquid chromatographic method has been evaluated over the linearity, precision, accuracy and suitability and proved to be convenient and effective for the quality control of alpha amyrin in plant extracts. The measured signal was found to be precise, accurate and linear over the concentration of range tested (0.008-0.032 mg mL-1) with a correlation coefficient of 0.9997. The proposed method on HPLC to determine alpha amyrin has been proved in a linear, precise, accurate, selective manner and encouraging its application in analysis applied in routine quality control. Acknowledgement The authors are highly indebted to the authorities of Jawaharlal Nehru Technological University, Kakinada for providing laboratory facilities. They are also thankful to the authorities of GITAM University for given moral support. REFERENCES [1] G. Kwefio-Okai, F. De Munk, B.A. Rumble, T.A. Macrides, M. Cropley, Res.Commun. Mol. Pathol. Pharmacol. 1994, 85, 45. [2] G. Kwefio-Okai, T.A. Macrides, Res. Commun. Chem. Pathol. Pharmacol. 1992, 77, 367. [3] F. Michel Otuki, Juliano Ferreira, V. Fabiana Lima, Cristiane Meyre-Silva, Angela Malheiros, A. Luciane Muller, S. Grazeila Cani, R.S. Adair santos, A. Rosendo Yunes, B. Joao Calixto, J. Pharmacol. and Exper. Ther. 2005, 313, 310. [4] T. Hayashi, K. Uchida, K. Hayashi, Chem. Pharma. Bull. 1990, 38, 239. [5] S.P. Ambasta, (Ed) The useful plants of India by Publication and Informative Directorate (CSIR) New Delhi, 1986) 562. 239 www.scholarsresearchlibrary.com
Naresh Kumar Katari et al _____________________________________________________________________________ Der Pharma Chemica, 2013, 5 (6):234-240 [6] E.S. Ayensu, (Ed) Medicinal plant of the West Indies, Reference Publication Inc. Michigan, 1981) 171. [7] K.R. Kritikar, B.D. Basu, Bishan Singh, Mahendrapal Singh, Indian Medicinal Plants, New Delhi 1984) 1823. [8] T. Hyashi, K. Okumara, M. Kawasaki, N. Morita, Phytochem. 1991, 85, 3617. [9] T. Hyashi, K. Okumara, Y. Tamoda, A. Lida, T. Fajita, N. Morita, Phytochem. 1993, 32, 349. [10] R.P. Rastogi, B.N. Malhotra, Compendium of Indian Medicinal Plants, Central Drug Research Institute Lucknow and Publication and Informative Directorate (CSIR) New Delhi, 1995) 664. [11] International Conference on Harmonization, Topic Q2B, Validation of Analytical Methods: Methodology. The Third International Conference on Harmonization of Technical Requirements for Registration of Pharmaceuticals for Human Use, Yokohama, Japan, 1997) [12] ICH- Harmonized Tripartity Guidelines Validation of Analytical Procedures Methodology, Commission of the European Communities, Geneva, 1996). 240 www.scholarsresearchlibrary.com