Download
1 / 12
130 likes | 177 Vues
A series of Cu(II) , Ni(II) , Co(II) , Mn(II) and Zn(II) complexes have been synthesized from the<br>schiff base ligand L. The schiff base ligand 2-[(4-oxo-4H-chromen-3yl) methyleneamino]<br>benzoic acid (L) has been synthesized by the reaction between chromone-3-carbaldehyde and oamino<br>benzoic acid. The nature of bonding and geometry of the transition metal complexes as<br>well as ligand L have been deduced from elemental analysis, FT-IR, UV-Vis, 1HNMR, 13CNMR,<br>ESR spectral studies, mass, thermal (TGA and DTA) analysis, magnetic susceptibility and molar<br>conductance measurements. The complexes are found to have ML2 composition and are neutral<br>in DMSO. Based on elemental, conductance and spectral studies, six-coordinated geometry was<br>assigned for these complexes. The ligand L acts as tridentate and coordinates through nitrogen<br>atom of azomethine group, hydroxyl of the carboxyl group and oxygen atom of keto group of γ-<br>pyrone ring. The 3D molecular modeling and energies of all the compounds are furnished and<br>their analysis for bond length has been carried out for one of the representive complexes. The<br>biological activity of the ligand and its complexes have been studied on E.coli, L.bacillus,<br>B.subtilis and S.aures by well disc and fusion method and found that the metal chelates are more active than the free schiff base ligand. <br>

E N D
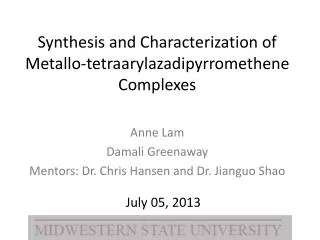
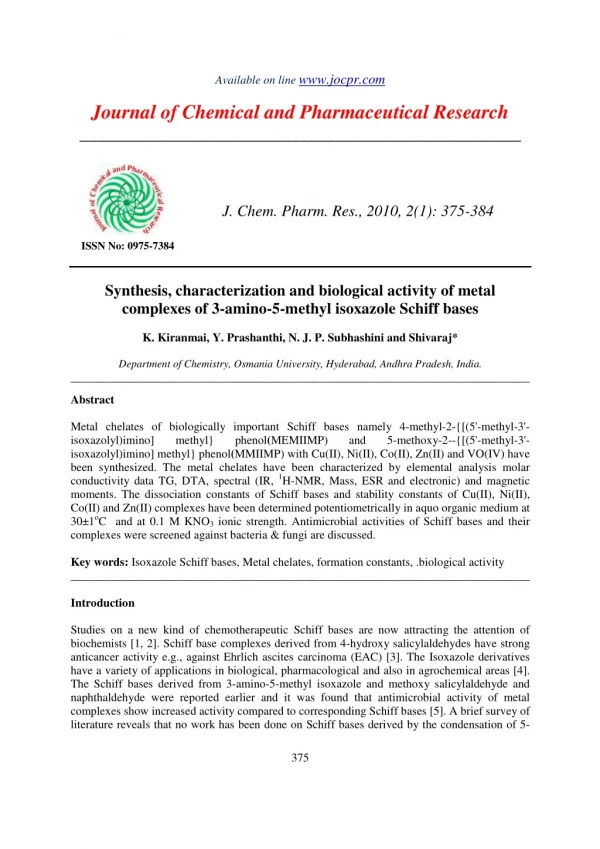
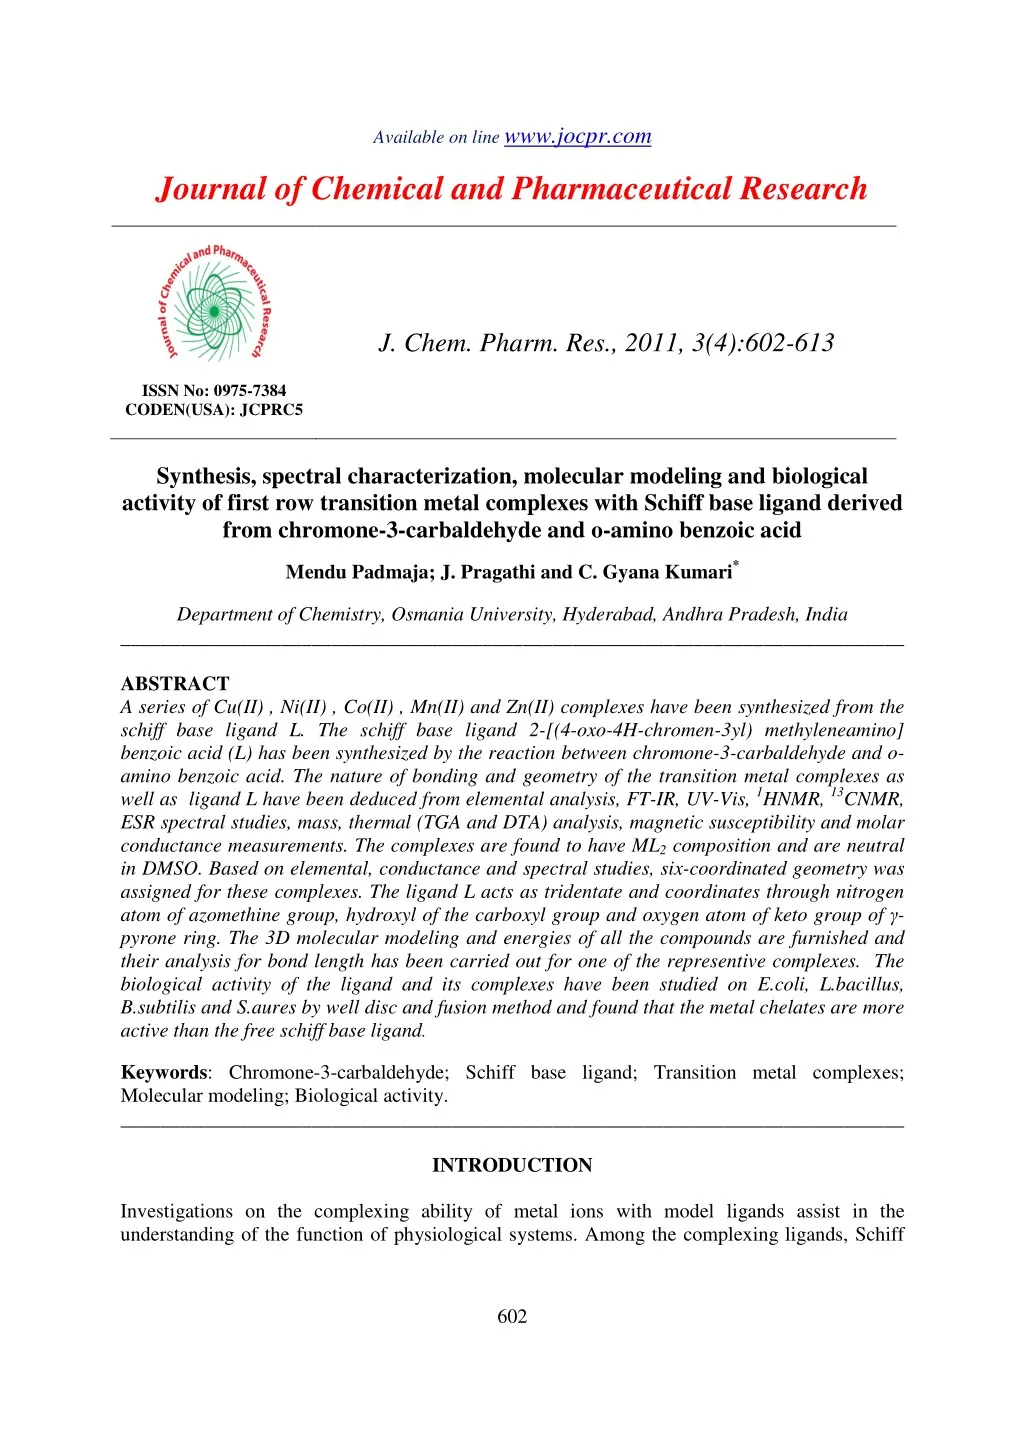
www.jocpr.com Available on line Journal of Chemical and Pharmaceutical Research J. Chem. Pharm. Res., 2011, 3(4):602-613 ISSN No: 0975-7384 CODEN(USA): JCPRC5 Synthesis, spectral characterization, molecular modeling and biological activity of first row transition metal complexes with Schiff base ligand derived from chromone-3-carbaldehyde and o-amino benzoic acid Mendu Padmaja; J. Pragathi and C. Gyana Kumari* Department of Chemistry, Osmania University, Hyderabad, Andhra Pradesh, India ______________________________________________________________________________ ABSTRACT A series of Cu(II) , Ni(II) , Co(II) , Mn(II) and Zn(II) complexes have been synthesized from the schiff base ligand L. The schiff base ligand 2-[(4-oxo-4H-chromen-3yl) methyleneamino] benzoic acid (L) has been synthesized by the reaction between chromone-3-carbaldehyde and o- amino benzoic acid. The nature of bonding and geometry of the transition metal complexes as well as ligand L have been deduced from elemental analysis, FT-IR, UV-Vis, 1HNMR, 13CNMR, ESR spectral studies, mass, thermal (TGA and DTA) analysis, magnetic susceptibility and molar conductance measurements. The complexes are found to have ML2 composition and are neutral in DMSO. Based on elemental, conductance and spectral studies, six-coordinated geometry was assigned for these complexes. The ligand L acts as tridentate and coordinates through nitrogen atom of azomethine group, hydroxyl of the carboxyl group and oxygen atom of keto group of γ- pyrone ring. The 3D molecular modeling and energies of all the compounds are furnished and their analysis for bond length has been carried out for one of the representive complexes. The biological activity of the ligand and its complexes have been studied on E.coli, L.bacillus, B.subtilis and S.aures by well disc and fusion method and found that the metal chelates are more active than the free schiff base ligand. Keywords: Chromone-3-carbaldehyde; Schiff base ligand; Transition metal complexes; Molecular modeling; Biological activity. ______________________________________________________________________________ INTRODUCTION Investigations on the complexing ability of metal ions with model ligands assist in the understanding of the function of physiological systems. Among the complexing ligands, Schiff 602
C. Gyana Kumari et al ______________________________________________________________________________ J. Chem. Pharm. Res., 2011, 3(4):602-613 bases have special interest due to their industrial and biological applications [1-10]. Earlier work reported that some drugs showed increased activity when administred as metal complexes rather than as organic compound [11-13]. Chromone derivatives have received great attention for their applications. These compounds exhibit a wide spectrum of biological activities including antimicrobial [14, 15] ,antibacterial [16, 17], antitumor [18], antifungal [19-21], antallergic [22], antiviral [23], anti-inflammatory [24] and anticancer [25] activities. Additionally, chromone derivatives are essential for the synthesis of many important oxygen heterocycles, pyrazoles and xanthones [26], o-aminobenzoic acid also show biological activity such as anticonvulsant activity. The schiff base derived from chromone-3-carbaldehyde and o-amino benzoic acid has important biological applications. Hence, we have synthesized the transition metal complexes with this ligand and we have carried characterization by various spectroscopic techniques, elemental analysis, molecular modeling analysis and antibacterial studies. EXPERIMENTAL SECTION 2.1 Chemicals: chromone-3-carbaldehyde, o-amino benzoic acid were purchased from Sigma- Aldrich chemicals and the remaining chemicals were purchased from commercial sources and used as such without purification. 2.2 Synthesis of the Schiff base ligand (L): The Schiff base ligand is prepared by condensation of chromone-3-carbaldehyde (1.74g, 0.01 mole) and o-amino benzoic acid (1.37g, 0.01 mole) in absolute ethanol (25ml), by adding traces of glacial acetic acid the mixture was refluxed for 2 hrs with continuous stirring. The yellow color compound was separated out after 12 hrs. The compound is collected by filtration, washed several times with doubly distilled water and ethanol, recrystallized from hot ethanol and dried in a vaccume desiccator. The melting point of the resulting Schiff base ligand (fig-1) is 96oC. The yield is 94%. 2-((4-oxo-4H-chromen-3yl) methyleneamino) benzoic acid (L) Figure-1. Proposed Structure of Schiff base ligand (L) 2.3 Synthesis of metal complexes: The Schiff base ligand L (0.01M) is dissolved in hot methanol and hot methanol solution of corresponding salts (0.005M) MX2 [where M = Cu(II), Ni(II), Co(II), Mn(II) and Zn(II) and X= chloride/nitrate/acetate] were mixed together and refluxed with constant stirring for 2-3 hrs at refluxing temperature. On cooling colored solids were precipitated out. The products were filtered, washed with cold methanol, dried in air and 603
C. Gyana Kumari et al ______________________________________________________________________________ J. Chem. Pharm. Res., 2011, 3(4):602-613 desiccator over anhydrous CaCl2 and stored in an airtight sample bottle. All the compounds are colored and are stable when exposed to air and moisture. 2.4 Instruments used: The percentage composition of C, H, and N of complexes and ligand L were determined using micro analytical methods on Perkin Elmer 240C (USA) elemental analyzer. FT-IR spectra of the ligand and its complexes were recorded by using KBr pellets in the range 4000-400 cm-1 on Perkin Elmer Infra red model 337. The UV-Visible spectra of the Schiff base ligand and its metal complexes were carried out in DMSO using a Shimadzu UV- 1601 spectrophotometer. 1H NMR spectrum of the ligand was recorded at 200MHz and 300MHz on Varian Gemini Unity Spectrometer using TMS as internal standard. 13C NMR spectra of the ligand was recorded at 100.6 MHz on Varian Gemini Spectrometer. The mass spectra of the compounds were recorded by ESI technique on VG AUTOSPEC mass spectrometer. The X- band ESR spectra was recorded with a EPR VARIAN-E-112 at RT. TGA and DTA analysis of complex was carried on Mettler Toledo Star system in the temperature range 0-1000oC. The heating rates were controlled by 10oC min-1. Magnetic measurements were carried out on a Gouy balance model 7550 using Hg[Co(NCS)4] as standard. The conductivity measurements were carried out in DMSO (10-3M) using Digisun Electronic Digital conductivity meter, 0.01M KCl solution is used for calibration. Melting points of the ligand and decomposition temperature of complexes were determined on Polmon instrument (model No.MP-96). Molecular modeling and analysis of the compounds were carried out using Chem Office software. 2.5 Biological activity: The antibacterial activity of Schiff base ligand and its transition metal complexes were studied against four bacteria, E.coli, L.bacillus, B.subtilis and S.aures. Each of the compound is dissolved in DMSO at a concentration of 1mg/ml. Paper discs of Whatmann filter paper No.1 are used after sterilization. The paper discs were saturated with 10µl of the compound dissolved in DMSO solution and were placed in Petri dishes containing nutrient agar media inoculated with the above-mentioned bacteria separately. The inhibition zone was measured in millimeters after 24 hrs incubation at 37oC. Table-1. Analytical and physical data of ligand L and its complexes Molar Conductance (Ohm-1 cm2 mol-1) _ 29.2 12.3 21.5 13.5 11.9 Melting Point in oC Empirical formula Molecular weight Yield (%) Compound Color Schiff base ligand (L) Cu(II) complex Ni(II) complex Co(II) complex Mn(II) complex Zn(II) complex C17H11NO4 [Cu(C17H10NO4)2] [Ni(C17H10NO4)2] [Co(C17H10NO4)2] [Mn(C17H10NO4)2] [Zn(C17H10NO4)2] 293 648 643 643.4 639.4 649.9 Yellow Dark green green red Yellowish orange Dark yellow 94 63 68 71 61 65 96 152 182 112 252 260 RESULT AND DISCUSSION The analytical and physical data of Schiff base ligand and its metal chelates are given in table-1. The data shows that the ligand L forms a 1:2 (M : L) complexes with Cu(II), Ni(II), Co(II), Mn(II) and Zn(II) ions. The prepared complexes are found to have the general formulae [ML2] where M= Cu(II), Ni(II), Co(II), Mn(II) and Zn(II) and L is Schiff base ligand, it coordinates as 604
C. Gyana Kumari et al ______________________________________________________________________________ J. Chem. Pharm. Res., 2011, 3(4):602-613 an anion by losing proton of the carboxylic group. The charge on the complex is neutralized by the ligand L. Thus, the complexes are neutral in DMSO. 3.1 Molar conductance: Molar conductance of the complexes is measured in DMSO at a concentration of 0.001 M. The observed conductance values fall in the range of 10-30Ohm-1 cm2 mol-1, indicating that the complexes are non-electrolytes. The C, H, and N analysis of Schiff base ligand and its complexes are found in good agreement with the expected values. 3.2 IR spectra and mode of bonding The FT-IR spectral data of few important functional groups of the Schiff base ligand and its transition metal chelates are presented in table-2. Table-2. Characteristic IR stretching bands of Schiff base ligand and its metal complexes in cm-1 Compound ? ? ? ?C=O(γ-pyrone ring) ? ? ? ?C=N(azomethine) ? ? ? ?C-O(carboxylate) ? ? ? ?M-O? ? ? ?M-N C17H11NO4(L) 1692 [Cu(C17H10NO4)2] 1641 [Ni(C17H10NO4)2] 1638 [Co(C17H10NO4)2] 1614 [Mn(C17H10NO4)2] 1647 [Zn(C17H10NO4)2] 1651 The IR spectrum of the Schiff base ligand show a very strong absorption band at 1692 cm-1, which is characteristic of the ?(C=O) of γ-pyrone. In the spectra of analyzed complexes, this absorption band has shifted to the 1614–1651 cm-1 region, indicating the coordination of the Schiff base ligand through the oxygen atom present in the 4-position of γ-pyrone ring [27, 28]. The spectrum of free Schiff base ligand shows an absorption band at 1606 cm-1 assigned for the ?(C=N) of azomethine group. In the spectra of analyzed complexes, this absorption band have been shifted to lower region by about 13–21 cm-1, which confirms the coordination of azomethine group through nitrogen atom [29,30]. IR absorption spectrum of the Schiff base ligand shows a band at 1379 cm-1, characteristic of the ?(C-O) of carboxylic acid group. This absorption band is shifted to lower region of 1326–1366 cm-1 in the spectra of analyzed complexes, indicating the coordination of carboxylic group through oxygen [31] atom of C-O. In addition to the above, the IR spectra of metal chelates shows absorption bands at 521 – 533 cm-1 and 421 – 437 cm-1 are due to ?(M-O) and ?(M-N) respectively [32]. These bands are absent in the spectrum of free Schiff base ligand. 3.3 1H NMR spectra The 1H NMR spectrum of the Schiff base ligand is recorded in DMSO-d6. In the 1HNMR spectra of schiff base ligand a peak at 10.41 δ is assigned for the proton of carboxylic group and a singlet at 7.49 δ assignable for proton of azomethine group. 1606 1585 1587 1593 1586 1587 1379 1366 1328 1334 1344 1326 - - 521 524 527 532 533 433 432 437 434 421 605
C. Gyana Kumari et al ______________________________________________________________________________ J. Chem. Pharm. Res., 2011, 3(4):602-613 3.4 13CNMR spectra The 13C NMR spectrum of the Schiff base ligand is recorded in DMSO-d6. The azomethine carbon gives a peak at 151.07 δ, carbonyl carbon of γ- pyrone ring shows a peak at 175.75 δ and a peak at 160.28 δ is assigned for carbon atom of carboxylic group. Figure-2. IR spectrum of Zn(II) complex 3.5 Mass spectra of the compounds The mass spectral data of Schiff base ligand and its metal chelates are given in table–3. Mass spectra of the ligand and its metal chelates show molecular ion peaks, which are in good agreement with the expected values. The mass spectrum of ligand L gives a peak at 294 m/Z, which is assigned for [L+H] peak. Cobalt and copper complexes gives molecular ion peak at 645 and 651 m/Z respectively and are assigned as [M+1] peak. The mass spectrum of Ni(II) complex gives a peak at 646 m/Z and is assigned for [M+2] peak, copper complex gives a peak at 650 m/Z, is assigned for [M+2] peak, Mn(II) complex gives a molecular ion peak at 644 m/Z, which is assigned for [M+4] peak. Table-3. Mass spectral data of schiff base ligand and its metal chelates Compound Calculated mass m/Z Obtained mass m/Z Peak assigned C17H11NO4 293 [Cu(C17H10NO4)2] 648 [Ni(C17H10NO4)2] 644 [Co(C17H10NO4)2] 643.4 [Mn(C17H10NO4)2] 639.4 [Zn(C17H10NO4)2] 649.9 3.6 Magnetic moment and electronic absorption spectra The electronic absorption spectral data and magnetic moment values of Schiff base ligand and its transition metal chelates are given in table-4. The electronic spectrum of Schiff base ligand shows strong absorption bands at 30395 cm-1 and 33222 cm-1, which are attributed to n →Π* and Π→Π* transitions respectively [33]. 294 650 646 645 644 651 L+H M+2 M+2 M+1 M+4 M+1 606
C. Gyana Kumari et al ______________________________________________________________________________ J. Chem. Pharm. Res., 2011, 3(4):602-613 Table-4. Electronic absorption spectral data and magnetic moment values of Schiff base ligand and its transition metal chelates Absorption (? ? ? ?) in cm-1 30395 33222 Π→Π* [Cu(C17H10NO4)2] 22573 14771 18450 23866 12515 15847 24271 16638 23753 28985 [Zn(C17H10NO4)2] 23310 The observed magnetic momentum value of Cu(II) complex is 1.90 BM, falls within the range observed for distorted octahedral geometry. Further, the electronic spectra of Cu(II) complex shows one broad peak at 22573 cm-1 due to transition between 2Eg →2T2g indicating distorted octahedral geometry [34]. The Ni(II) complex exhibits peaks at 14771, 18450 and 23866 cm-1 attributed to the 3A2g(F) → 3T2g(F), 3A2g(F) →3T1g(F) and 3A2g(F) →3T1g(P) transitions respectively, suggests octahedral geometry. The magnetic moment value of Ni(II) complex is found to be 3.23 BM, falls within the range of 2.8-3.5 BM for octahedral complexes, suggesting octahedral geometry [35]. The magnetic moment of Co(II) complex has been found to be 4.94 B.M, and it lies within the range expected for octahedral geometry. The electronic spectrum of Co(II) complex shows three peaks at 12515, 15847 and 24271 cm-1 corresponding to 4T1g(F) →4T2g(F), 4T1g(F) →4A2g(F) and 4T1g(F) →4T1g(F), suggesting octahedral geometry [36]. The Mn(II) complex shows three absorption peaks at 16638 cm-1 expected for 6A1g→4T1g(S), at 23753 cm-1 corresponding to 6A1g→4T2g(G) and 28985 cm-1 may be due to 6A1g→4A1g, suggesting octahedral geometry [37]. Further, the octahedral geometry is proposed based on magnetic moment. The magnetic moment of the complex is found to be 5.71 BM, falls within the range expected for octahedral geometry. The electronic spectrum of Zn(II) complex show one peak at 23310 cm-1 due to charge transfer from ligand to metal. The observed magnetic moment value for this complex is zero, indicating diamagnetic nature of the complex. On the basis of analytical, conductance and spectral data, octahedral geometry [38] is assigned to zinc complex. 3.7 ESR spectral studies ESR spectra of Cu(II) complex (fig-3) was recorded at room temperature in the polycrystalline state, on X- band at frequency of 9.1 GHZ under the magnetic field strength of 3000G. The spectrum show one intense absorption in the high field and is isotropic due to tumbling of the Mag. Moment µ (B.M.) Compound Transition Geometry n →Π* C17H11NO4 - - 2Eg →2T2g 3A2g(F) →3T2g(F) 3A2g(F) →3T1g(F) 3A2g(F) →3T1g(P) 4T1g(F) →4T2g(F) 4T1g(F) →4A2g(F) 4T1g(F) →4T1g(P) 6A1g→4T1g(S) 6A1g→4T2g(G) 6A1g→4A1g CT 1.90 Octahedral [Ni(C17H10NO4)2] 3.23 Octahedral [Co(C17H10NO4)2] 4.94 Octahedral [Mn(C17H10NO4)2] 5.71 Octahedral dia Octahedral 607
C. Gyana Kumari et al ______________________________________________________________________________ J. Chem. Pharm. Res., 2011, 3(4):602-613 molecule. The g values of the complex are g|| (2.240) > g⊥(2.072) >2.0023, indicating that the unpaired electron in the ground state of Cu(II) is predominantly in dx2-y2. The value of exchange interaction term G, estimated from the following expression is 3.4. G = g|| - 2.0023/ g⊥ - 2.0023 If G>4.0, the local tetragonal axes are aligned parallel or only slightly misaligned. If G<4.0, significant exchange coupling is present and misalignment is appreciable. The observed value for the exchange interaction term G suggests that the complex has distorted octahedral geometry, and the Schiff base ligand forming Cu(II) complex is considered as strong field ligand. Figure–3. ESR spectra of Cu(II) complex The spin-orbit coupling constant, value (-716 cm-1) calculated using the relations, gav = 1/3[g|| + 2 g⊥] and gav = 2(1-2λ/10Dq), is less than the free Cu(II) ion (-832 cm-1) which supports covalent character [39]. EPR spectra of Mn(II) complexes were recorded as polycrystalline sample at RT. ESR spectrum of a polycrystalline sample gave one broad isotropic signal centered on the approximate free electron g value (2.0023). 3.8 Thermal analysis The thermal stability of Cu(II) complex is studied by controlling heating rates 10oC per minute under nitrogen atmosphere. Thermogram of Cu(II) complex is stable up to 250oC, indicates the absence of lattice water as well as coordinated water. Generally in TG lattice water loses at low temperature region between 60-120oC, where as coordinated water requires 120-250oC. Absence of water molecule in Cu(II) complex is supported by the DTA curve, which represents weight loss by endothermic bands. The DTA of copper complex has no endothermic band in the range of 60-250oC. Endothermic bands present at high temperature in DTA of Cu(II) complex is due to loss of organic molecules and finally metal may converts into its oxide [40, 41]. In addition to endothermic bands, the DTA curves of the complex also show exothermic bands. These bands appear at high temperature and represent phase transition, oxidation and/or decomposition of the complex. 3.9 Molecular modeling and analysis In view of the octahedral environment of all the complexes, the molecular modeling of all the complexes and ligand (L) were carried out here for the proposed structures and their energy 608
C. Gyana Kumari et al ______________________________________________________________________________ J. Chem. Pharm. Res., 2011, 3(4):602-613 values are given (fig-4). These values are obtained as a result of minimization of energy through MM2 method in Chem 3D Ultra 11.0. Fig-4(a). Ligand L (112.99 kcal/mol) Fig-4(b). Cu(II) complex (220.02 kcal/mol) Fig-4(c). Ni(II) complex (310.11 kcal/mol) Fig-4(d). Co(II) complex(390.88 kcal/mol) Fig-4(e). Mn(II) complex (237.71 kcal/mol) Fig-4(f). Zn(II) complex (200.61 kcal/mol) FIGURE-4. Molecular modeling of proposed structures The details of important bond lengths as per the 3D structure of Cu (II) complex [fig- 4(b)] are given in the table-5. These values are obtained as a result of energy minimization of Cu (II) complex in Chem 3D Ultra 11.0 using MM2 method. 609
C. Gyana Kumari et al ______________________________________________________________________________ J. Chem. Pharm. Res., 2011, 3(4):602-613 Table-5 Important bond lengths of copper complex Atom Bond atom C(34) N(38) C(12) N(16) C(15) N(16) C(37) N(38) C(3) O(4) C(13) O(22) C(25) O(26) C(35) O(44) N(38) Cu(45) N(16) Cu(45) O(4) Cu(45) O(22) Cu(45) O(26) Cu(45) O(44) Cu(45) Bond length (Ao) 1.305 2.207 2.202 1.642 1.308 1.249 1.219 1.251 1.392 1.368 1.827 1.834 1.829 1.841 The obtained bond lengths of the ligand (L) based on [fig-4(a)] using chem office software are between C(12)-N(16) [and C(34)-N(38)] 1.289 Ao, C(15)-N(16) [and C(37)-N(38)] 1.434 Ao, C(13)-O(22) [and C(35)-O(44)] 1.250 Ao and between C(3)-O(4) [and C(25)-O(26)] 1.208 Ao. The atoms in the brackets are corresponding to the other ligand of the same L. Based on the values in the table-5, it is observed that when these ligands (2L) are coordinated with the copper metal ion there is an increase in the bond length in between the above mentioned atoms, which confirms the coordination of azomethine group through nitrogen [N(16)and N(38)], carboxylate through oxygen of C-O [O(22) and O(44)] and carbonyl oxygen of γ-pyrone ring[O(4) and O(26)] with the metal ion. When the atoms are coordinated with the metal ion by donating a lone pair of electrons there is decrease of electron density on the coordinating atoms, hence bond length increases in metal complexes. This supports the proposed six-coordinated geometry around the copper metal ion. Based on the values in table-5, the bond lengths between copper and oxygen’s [1.82 – 1.84 Ao] is more than that of copper and nitrogen’s [1.36 and 1.39 Ao], which supports the distorted octahedron geometry for copper complex. Based on all the above studies the following structure is proposed for the metal complexes. Where M= Cu(II), Ni(II), Co(II), Mn(II) and Zn(II) ions Figure-5. Proposed structures of metal complexes 610
C. Gyana Kumari et al ______________________________________________________________________________ J. Chem. Pharm. Res., 2011, 3(4):602-613 3.10 Biological activity studies The antimicrobial activity of the Schiff base ligand and its metal chelates were tested against the bacteria E.coli, L.bacillus, B.subtilis and S.aures by the well disc and fusion method. The test solutions were prepared in DMSO at a concentration of 1mg/ml. The zone of inhibition values were measured in millimeter after 24 hrs incubation at 37oC. The antibacterial results are given in table-6. Table-6. Antibacterial activity in millimeter (mL) Compound E.coli B.subtilis L.bacillus S.aures C17H11NO4 7.6 8.6 9.0 8.2 [Cu(C17H10NO4)2] 10.0 15.6 17.0 17.0 [Ni(C17H10NO4)2] 15.0 10.3 22.0 11.0 [Co(C17H10NO4)2] 29.0 20.0 23.6 21.0 [Mn(C17H10NO4)2] 8.3 9.3 11.3 8.6 [Zn(C17H10NO4)2] 15.6 12.3 16.6 17.6 The value in the above table indicates that the activity of the Schiff base ligand became more pronounced when coordinated with the metal ions. This enhancement in antibacterial activity of these metal complexes can be explained based on the chelation theory [42]. When a metal ion is chelated with a ligand, its polarity will be reduced to a greater extent due to the overlap of ligand orbital and the partial sharing of the positive charge of the metal ion with donor groups. Furthermore, the chelation process increases the delocalization of the π-electrons over the whole chelate ring, which results in an increase in the lipophilicity of the metal complexes. Consequently, the metal complexes can easily penetrate into the lipid membranes and block the metal binding sites of enzymes of the microorganisms. These metal complexes also affect the respiration process of the cell and thus block the synthesis of proteins, which restrict further growth of the organism. Antibacterial activity against E.coli, where 1 is Co(II) complex and 2 is Ni(II) complex Figure-6. Antibacterial activity 611
C. Gyana Kumari et al ______________________________________________________________________________ J. Chem. Pharm. Res., 2011, 3(4):602-613 CONCLUSION 2-[(4-oxo-4H-chromen-3yl) methyleneamino] benzoic acid (L) and its transition metal complexes have been synthesized in 2:1 molar ratio of ligand (L) to metal ion. They have been characterized based on the analytical, spectral, thermal and magnetic measurements. The results of these investigations support the suggested structure of the metal complexes. Molar conductance values analytical data suggests that the complexes are neutral in DMSO. The ESR spectrum of the copper complex suggests the partial covalent nature of the bond between metal and ligand and distorted octahedron geometry. Thermal analysis of Cu(II) complex indicates the absence of water molecules in the complex. All the six complexes possess octahedral environment around the metal ion. This was further supported by the molecular modeling studies. Biological activity of the Schiff base ligand and its metal complexes were studied and results shows that the activity of the metal complexes is higher than the free Schiff base ligand. REFERENCE [1]K. Osz; K. Varnagy; H. S.Vargha; A. Csampay; D. Sanna; G. Micera and I. Sovago, J. Inorg. Biochem., 2004, 98(1), 24-32. [2] J.A. Tainer; D.E. Getzoff; J.S. Richardson and D.C. Richardson, Nature, 1983, 306, 5940, 284-286. [3]W.A. Alves; IA. Bagatin and A.M.D.C. Ferreria, Inorg. Chim. Acta, 2001, 321(1-2), 11-21. [4]N.V. Nagy; TS. Planka; A. Rockenbauer; G. Peintier; I. Nagypal; L. Korencz, J. Am. Chem. Soc., 2003, 125(17), 5227-5235. [5]W.L. Liu; Y. Zou; C.L. Ni; Z.P. Ni; Y.Z. Li and Q. Jin, J. Coord. Chem., 2004, 57(8), 657- 664. [6]L.S. Long; S.P. Yang; X.M. Chen; Y.X. Tong and L.N. Ji, J. Chem. Soc., Dalton Trans., 1999, 312(12), 1999-2004. [7]M.S. Nair; S. Sudhakumari; M.A. Neelakanta, J. Coord. Chem., 2007, 60(1), 1-51. [8]R.S. Joseyphus; C.J. Dhanaraj and M.S. Nair, Transition Met. Chem.,2006, 31(6), 699-702. [9]Y.Anjaneyula and R.P. Rao, Synth. React. Met.-Org. Chem.,1986, 16(2), 257-272. [10]Z.H. Chohan; M. Asifa and C.T. Supuran, Metal Based Drugs, 2001, 8(3), 137-143. [11]Y. Prasanthi; K. Kiranmai; N.J.P. Subhashini and Shivaraj, Spectrochimica Acta, Part A., 2008, 70(1), 30-35. [12]E. M. Hodnett and P. D. Mooney, J. Med. Chem., 1970, 13(4),786. [13]E. M. Hodnett and W. J. Dunn, J. Med. Chem., 1972, 15(3), 339. [14]H. Goker; D.W. Boykin and S. Yildiz, Bioorg. Med. Chem., 2005, 13(5), 1707-1714. [15]M. J. Nawort; E. Nawrot and J. Graczyk, Eur. J. Med. Chem., 2006, 41(11), 1301-1309. [16]J.B. Harborne and C.A. Williams, Photochemistry, 2000, 55(6), 481-504. [17]N.R. Guz; F.R. Stermitz; J.B. Johnson; T.D. Beeson; S. Willen; J.F. Hastang and K. Lewis, J. Med. Chem., 2001, 44(2), 261-268. [18]E.A. Yakout, Egypt. J. Chem., 2004, 45(6), 1029-1042. [19]T.E. Ali; S.A. Ghfaar; H.M. El-Shaaer; F.I. Hanafy and A.Z. El-Fauomy, Turk. J. Chem., 2008, 32(3), 365-374. [20]T.E. Ali, Phosphorous, Sulfur, and Silicon, 2007, 182(8), 1717-1726. [21]M. Uher;V. Konecny and O. Rajniakova, Chem. Pap., 1994, 48(4), 282-284. 612
C. Gyana Kumari et al ______________________________________________________________________________ J. Chem. Pharm. Res., 2011, 3(4):602-613 [22]M. Ohata; K. Watanabe; K. Kumata; K. Hisamichi; S. Suzuki and H. Ito, Annu. Rep. Tohoku Coll. Pharm., 1991, 38, 35. [23]N. Desideri; P. Mastromarino and C. Conti, Antiviral Chem. And Chemotherapy, Chem. Abstr., 2003, 14(4), 195-203. [24]K. Jerzy and Z. Teodor, Chem. Abstr., 1995, 123, 339629. [25]L. Denis; M.S. Morton and K. Griffith, Eur. Urol.,1999, 35(5-6), 377-387. [26]V. Arjunan; S. Subramanian and S. Mohan, Spectrochim. Acta A, 2004, 60(5), 995-1000. [27]P. Tharmaraj; D. Kondimunthiri; C.D. Sheela and C.S. Priya, J. Coord. Chem., 2009, 62(13), 2220-2228. [28]E. Ispir; M. Kurtoglu and F. Purtas, Transition Met. Chem., 2005, 30(6), 765-770. [29]G.G. Mohamed and Z.H. Abd El-Wahab, J. Thermal Ana. and Colorimetry, 2003, 73(1), 347-380. [30]A. I. Magdy and K.M. El-Mahdy, Phosphorous, Sulfur, and Silicon, 2009, 184, 2945. [31]K. Mounika; B. Anupama; J. Pragathi and C. Gyanakumari, J. Scintific Research, 2010, 2(3), 513-524. [32]K. Ramakrishna Reddy;, K. Madhusudhan Reddy and K.N. Mahendra, Indian J. Chem., 2006, 45A(2), 377-381. [33]E. Conpolat and M. Kaya, J. Coord. Chem., 2004, 57(14), 1217-1223. [34]N.Raman; S. Ravichandran and C. Thangarajan, J. Chem. Sci., 2004, 116, 215-219. [35]Lever ABP, J. Chem. Edu., 1968, 45(11), 711-712. [36]N. Ramam; A. Kulandaisami and A. Shunmugasundaram, Trans Met Chem., 2001, 26(1-2), 131-135. [37]D.S. Sankhala; R.C. Mathur and S.N. Mishra, Indian J. Chem., 1980, 19A, 75. [38]P.K. Panchal; H.M. Parekh; P.B. Pansuriya and MN Patel, J. Enzyme Inhibit Med. Chem., 2006, 21(2), 203-209. [39]N. Raman; J. Joseph; A. Sakthivel and R. Jeyamurugan, J. Chil. Chem. Soc., 2009, 54(4), 354-357. [40]E. S. Freeman and B. J. Carroll, J. Phy. Chem., 1958, 62, 394-397. [41]A. P. Mishra and M. Khare, J. Ind. Chem. Soc., 2000, 77, 367. [42]L. Mishra and VK. Singh, Indian J. Chem. Soc., 1997, 32A, 446. 613