Download
1 / 128
1.28k likes | 1.34k Vues
Slideshow about Social Media Around the World 2012 by Tom De Ruyck

E N D
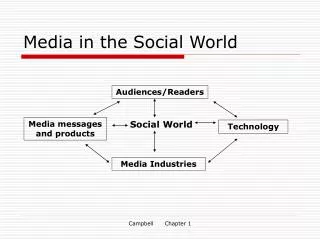
What to expect from this presentation Five eye-catching insights on the status of social media based on a large consumer survey. >2,000 facts and figures about social media in 19 countries. The topics cover main adoption and usage, interactions of consumers with brands, impact of branded conversations, evolution of mobile and the opportunities for structural collaboration between consumers and brands.
Studied countries Data collected by online research panel provider SSI, field work in Q2 2012, analyses conducted by research company InSites Consulting and translations performed by translation agency No Problem. 7,827 consumers (age 15+) across 19 countries, representative for the online population within country on gender, age and e-commerce.
Eye-catching conclusions
1The social media landscape is rather stable
Awareness of social network sites is very high. Facebook is close to 100%, Twitter reaches 80% awareness and Google+ is known by 70%. More than 7 out of 10 internet users are member of at least 1 social network. This implies that more than 1.5 billion people use social network sites.
The world is not waiting for the next social network. In fact, most people want to keep their digital life as it is. No need for something new and no intention to quit. On average, people only join 1 or 2 social networks. The Twitter & Google+ paradoxes are living evidence for this conclusion: both sites are very well known, but their adoption is still rather low.
Consumers are willing to join ‘unique’ new social networks Awareness of new social networks like Instagram and Pinterest is picking up. 25% know Instagram, 24% are aware of Pinterest. Further, users show a very high intention to use both sites more in the future.
2Mobile is the perfect accelerator for social media usage
Boost in adoption of smart phones: 51% of internet users have a smartphone, most have a data subscription on it.
On average, people install 22 apps on their smartphone, 9 of which are used at least weekly. Social network apps are the most popular ones.
53% of smartphone users compare prices during shopping via their smartphone.
3Consumers connect and interact with a limited set of brands
Consumers are more positive than you might think. More than half of their comments about brands are positive. Fewer than 10% are negative.
50% post information about products, brands and/or companies on social networks. Product experience Conversation Starters Promotions Contests News Advertising: decreases
55% of social network users are connected to brands. 7.0 is the average number of brands followed actively 10.6 is the average number of brands followed 5.0 is the average number of brands followers interact with
Clear expectations from consumers vis-à-vis brands: 1. Share product info 2. Do promotions 3. Give away free stuff 4. Bring news 5. Use us in co-creation projects
4Consumers reach out to brands: we want to help you!
8/10 consumers want to help in co-creation projects of companies they like. The only thing they ask in return: give us feedback on what you do with our input.
Market research communities are highly appreciated by consumers. 36% prefer to participate in a branded research community. These communities come second after a Facebook community. Consumers believe that their feedback will have a high impact in a research community. The latter is their key motivation to help brands.
The customer is open to co-creation, but many companies are not. The challenge is to integrate the vision of the customer in every organization, all the way to the boardroom.
Consumers are probably the most effective consultants your company can hire.
5Opportunity for brands to optimize conversation potential of consumers
Until now, we only used the first dimension of social media
First dimension: build reach
Second dimension: collaboration
High By combining these two dimensions, brands can optimize the conversation potential of their consumers. Each of these quadrants has value in a conversation strategy. Structural collaboration Low High Low Reach
High Broad, open collaboration Consumer consulting board Structural collaboration Low High Conversations Customer experience Content Low Reach
Do you want to learn more? Well, just keep on reading. The rest of the report is filled with more than 2,000 facts & figures about social networks. We hope it can help you in your business cases, it inspires you, and you will share our work with your friends. If you have any questions, please let us know: Marketing@insites-consulting.com @InSites
1. Social media behavior
1. The facts about social media around the world Almost 100% of people are aware of Facebook. About 80% have heard of Twitter and 7 out of 10 people are aware of Google+. Facebook still owns the social media landscape as more than 60% of the internet population uses Facebook. Twitter and Google+ have a population of about the same size (about 20% penetration). However, Twitter usage frequency is a lot higher than Google+’s. Around the world we see the same trend: social networks are part of the daily lives of consumers. 6 out of 10 people go at least once a day to a social network site. The awareness of the new photo-sharing platforms Instagram and Pinterest is still rather limited: 17% are aware of Instagram & 11% of Pinterest. The results show that both sites have a very strong growth potential.
1. The facts about social media around the world On average, people join 1-3 social networks. The majority have an account at two sites. Fewer than 10% of people join 5 or more social network sites. LinkedIn has an awareness of about 40%. It remains a niche B2B site with a very clear profile vis-à-vis the market and its users. The motivations to use social networks are communication with friends & family, killing time, sharing photos and sharing interesting information.
34 > 7 out of 10 internet users are members of at least 1 social network. > 1.5 billion people are using social networks.
Emerging markets such as Argentina, Brazil & India have the highest penetration of social network usage. Further, they have the highest usage frequency and intensity as well.
On average, people join 2.1social networks. Most often this is Facebook in combination with Twitter or LinkedIn. It will become difficult for new platforms to find their place unless they offer a complete new value. Instagram & Pinterest have the highest possibility of finding their place.
LinkedIn continues to have relatively low awareness. About 4 out of 10 internet users are familiar with this social network. LinkedIn keeps it strong niche position with respect to the B2B market.
2 very strong local players Vkontakte is big in Russia: 52% awareness, 35% penetration. Qzone is big in China: 63% awareness, 35% penetration.
Top networks Twitter and Google+ both have a large number of people who know them, but are not members. Aware and current member Aware and once a member Aware, but not a member Not aware Facebook Twitter Google+ LinkedIn 89% 78% 73% 46% Awareness 58% 23% 25% 16% Membership Base: Social networkers 42% 42% 52% 40% Increase in usage (top 2%, 1-5) 67% 51% 49% 31% Daily log-on Base: Members of this network
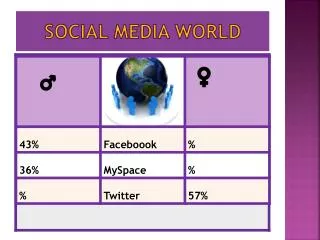
Member profile All social networks are dominated by men. LinkedIn and Twitter members are most likely to be employed and have a smartphone. Facebook Twitter Google+ LinkedIn Gender 52% 48% 54% 46% 57% 43% 55% 45% Male Female Age Age 21% 28% 36% 16% 22% 31% 36% 12% 13% 31% 42% 14% 22% 32% 36% 10% 15-24 25-34 35-54 55-99 Smartphone Smartphone 53% 63% 68% 67% Smartphone user Working situation Working situation 57% 12% 31% 56% 11% 33% 64% 12% 24% 67% 11% 22% Employed Student Not working N = Min 878 / F = If member of social network(s)
Awareness, penetration & average number of network membership 97% 75% 1.8 Aware of at least one network 95% 73% 1.8 Member of at least one network Average number of networks one is member of 90% 45% 1.0 82% 52%* 2.6 97% 79% 2.0 Emerging markets Brazil, Argentina and India show the highest rates for awareness, penetration and average # of memberships. 97% 82% 2.5 98% 85% 3.0 97% 72% 1.6 98% 91% 2.5 * The 52% and 45% share of social networkers in China and Japan is low compared to other countries. This might be due to the fact that some large Chinese and Japanese networks (e.g. RenRen) were not included in this survey.
Awareness, penetration, average number of networks Aware of at least one network 97% 75% Member of at least one network Average number of networks one is member of 1.8 East West 97% 78% 1.9 97% 74% 1.7
# of networks one is a member of Japan and Australia have the highest number of people who are members of only 1 network. average 1.8 2.0 1.8 1.6 2.5 3.0 2.6 2.5 1.0 N Europe = 3604 / F = If member of social network(s)
Daily log-on to social media 67% 63% 55% 66% 68% 78% 76% Daily log-on is highest in Argentina, Brazil and India. 82% 70%
Daily log on Q : You are a member of the following social network sites. How often do you log on to these sites? (at least daily) Qzone, Facebook and Vkontakte have the highest penetration of daily usage. 69% of the Qzone users log on at least once a day. N = Min 104 / F = If member of social network
Top 3 networks by membership After Facebook, Vkontakte is the most popular network in Eastern Europe. East West
Network awareness Q : To what extent do you know the following social network sites? Total Global benchmark Global benchmark In Europe, Facebook, Twitter and Google+ are the best- known social networks. N = 5517/ F = None
Network membership Q : To what extent do you use the following social network sites? Total Global benchmark In terms of membership, Facebook, Google+ and Twitter are most popular in Europe. In China, Qzone is most popular. Orkut is popular in Brazil and India. N = 5517/ F = None
Pinterest & Instagram Aware and current member Aware and once a member Aware, but not a member Not aware Pinterest Instagram 24% 25% Awareness 3% 4% Membership Base: Social networkers 60% 40% Increase in usage (top 2%, 1-5) 51% 31% Daily log-on Base: Members of this network