Download
1 / 51
510 likes | 667 Vues
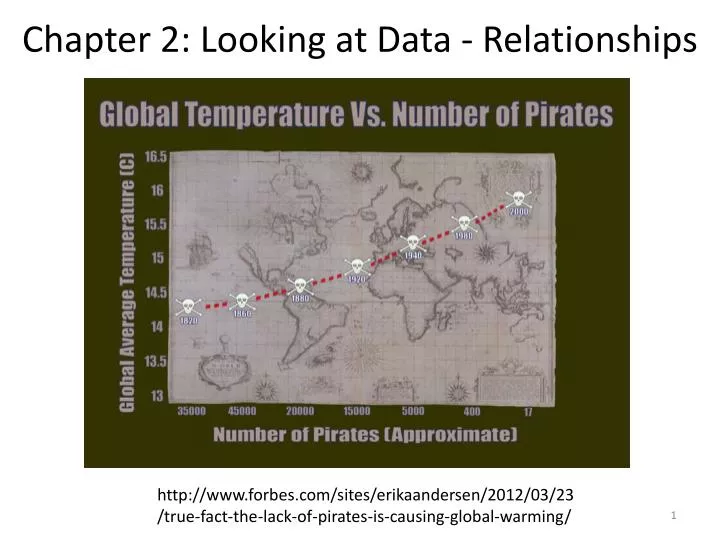
Chapter 2: Looking at Data - Relationships. http://www.forbes.com/sites/erikaandersen/2012/03/23 /true-fact-the-lack-of-pirates-is-causing-global-warming/. General Procedure. Plot the data. Look for the overall pattern. Calculate a numeric summary.

E N D
Chapter 2: Looking at Data - Relationships http://www.forbes.com/sites/erikaandersen/2012/03/23 /true-fact-the-lack-of-pirates-is-causing-global-warming/
General Procedure • Plot the data. • Look for the overall pattern. • Calculate a numeric summary. • Answer the question (which will be defined shortly)
2.1: Relationships - Goals • Be able to define what is meant by an association between variables. • Be able to categorize whether a variable is a response variable or a explanatory variable. • Be able to identify the key characteristics of a data set.
Questions • What objects do the data describe? • What variables are present and how are they measured? • Are all of the variables quantitative? • Are the variables associated with each other?
Association (cont.) Two variables are associated if knowing the values of one of the variables tells you something about the values of the other variable. • Do you want to explore the association? • Do you want to show causality?
Variable Types • Response variable (Y): outcome of the study • Explanatory variable (X): explains or causes changes in the response variable
Key Characteristics of Data • Cases: Identify what they are and how many • Label: Identify what the label variable is (if present) • Categorical or quantitative: Classify each variable as categorical or quantitative. • Values. Identify the possible values for each variable. • Explanatory or Response: Classify each variable as explanatory or response.
2.2: Scatterplots - Goals • Be able to create a scatterplot (lab) • Be able to interpret a scatterplot • Pattern • Outliers • Form, direction and strength of a relationship • Be able to interpret scatterplots which have categorical variables.
Scatterplot - Procedure • Decide which variable is the explanatory variable and put on X axis. The response variable goes on the Y axis. • Label and scale your axes. • Plot the (x,y) pairs.
Example: Scatterplot The following data is to determine the relationship between age and change in systolic blood pressure (BP, mm Hg) after 24 hours in response to a particular treatment. a) Draw a scatterplot of this data.
Example: Scatterplot (cont) Age Age
Pattern • Form • Direction • Strength • Outliers
No relationship Nonlinear Pattern Linear
Scatterplot with Categorical Variables http://statland.org/Software_Help/Minitab/MTBpul2.htm
2.3: Correlation - Goals • Be able to use (and calculate) the correlation to describe the direction and strength of a linear relationship. • Be able to recognize the properties of the correlation. • Be able to determine when (and when not) you can use correlation to measure the association.
Sample correlation, r(Pearson’s Sample Correlation Coefficient) X
Properties of Correlation • r > 0 ==> positive association r < 0 ==> negative association • r is always a number between -1 and 1. • The strength of the linear relationship increases as |r| moves to 1. • |r| = 1 only occurs if there is a perfect linear relationship • r = 0 ==> x and y are uncorrelated.
Example: Positive/Negative Correlation 1) Would the correlation between the age of a used car and its price be positive or negative? Why? 2) Would the correlation between the weight of a vehicle and miles per gallon be positive or negative? Why?
Comments about Correlation • Correlation makes no distinction between explanatory and response variables. • r has no units and does not change when the units of x and y change.
Cautions about Correlation • Correlation requires that both variables be quantitative. • Correlation measures the strength of LINEAR relationships only. • The correlation is not resistant to outliers. • Correlation is not a complete summary of bivariate data.
Questions about Correlation • Does a small r indicate that x and y are NOT associated? • Does a large r indicate that x and y are linearly associated?
2.4: Least-Squares Regression - Goals • Be able to generally describe the method of ‘Least-Squares Regression’ • Be able to calculate and interpret the regression line. • Using the least square regression line, be able to predict the value of y for any appropriate value of x. • Be able to calculate r2. • Be able to explain the meaning of r2. • Be able to discern what r2 does NOT explain.
Linear Regression ŷ = b0 + b1x b0 = ȳ - b1x̄
Example: Regression Line ŷ = 20.11 - 0.526x Age
Example: Regression Line The following data is to determine the relationship between age and change in systolic blood pressure (BP, mm Hg) after 24 hours in response to a particular treatment. x̄ = 52.727, ȳ = -7.636, sx = 14.164, sy = 9.688, r = -0.76951 b) What is the regression line for this data? c) What would the predicted value be for someone who is 51 years old?
Facts about Least Square Regression • Slope: A change of one standard deviation in x corresponds to a change of r standard deviations in y. • Intercept: the value of y when x = 0. • The line passes through the point (x̄,ȳ). • There is an inherent difference between x and y.
r2 • Coefficient of determination. • Fraction of the variation of the values of y that is explained by the least-squares regression of y on x.
Example: Regression Line The following data is to determine the relationship between age and change in systolic blood pressure (BP, mm Hg) after 24 hours in response to a particular treatment. d) What percent of variation of Y is due to the regression line?
Beware of interpretation of r2 • Linearity • Outliers • Good prediction
2.5: Cautions about Correlation and Regression - Goals • Be able to calculate the residuals. • Be able to use a residual plot to assess the fit of a regression line. • Be able to identify outliers and influential observations by looking at scatterplots and residual plots. • Be able to determine when you can predict a new value. • Be able to identify lurking variables that can influence the relationship between two variables. • Be able to explain the different between association and causation.
Example: Regression Line The following data is to determine the relationship between age and change in systolic blood pressure (BP, mm Hg) after 24 hours in response to a particular treatment. e) What is the residual for someone who is 51 years old?
Residual Plots Good Linearity Violation
Residual Plots Good Constant variance violation
Residual Plots – Bp Original Y outlier
Residual Plots – Bp Original X outlier
Cautions about Correlation and Regression: • Both describe linear relationship. • Both are affected by outliers. • Always PLOT the data. • Beware of extrapolation. • Beware of lurking variables • Lurking variables are important in the study, but are not included. • Confounding variables confuse the issue. • Correlation (association) does NOT imply causation!
Lurking Variables 1. For children, there is an extremely strong correlation between shoe size and math scores. 2. There is a very strong correlation between ice cream sales and number of deaths by drowning. 3. There is very strong correlation between number of churches in a town and number of bars in a town.
What is the lurking variable? http://www.forbes.com/sites/erikaandersen/2012/03/23 /true-fact-the-lack-of-pirates-is-causing-global-warming/
2.7: The Question of Causation - Goals • Be able to explain an association • Causation • Common response • Confounding variables • Apply the criteria for establishing causation.
Causation Association does not mean causation!