Download
1 / 25
250 likes | 380 Vues
Economic Performance. Mr. Bammel. Output. Output is the amount of products that are being produced in all spectrums of the market; We use the measure of Gross Domestic Product (GDP) in order to understand a nation’s output.

E N D
Economic Performance Mr. Bammel
Output • Output is the amount of products that are being produced in all spectrums of the market; • We use the measure of Gross Domestic Product (GDP) in order to understand a nation’s output. • GDP is the dollar amount of all final goods and services produced within a country’s national borders in a year. • GDP is the overall most important measure of all economic activity.
Computing GDP • Basically, you just multiply ALL final goods and services produced in a 12-month period by their prices, then add up all those numbers across the entire country. • Draw a Pictograph, a series of pictures to show your understanding of what something means, of the definition of GDP;
Excluded Products • Look back at the definition of GDP: • GDP is the dollar amount of all final goods and services produced within a country’s national borders in a year. • Analyze the wording of the definition; what would be the some things that would be EXCLUDED from this final number.
Read page 343, write down the things that are excluded from GDP, explain each of them, and tell me why they would be excluded. • On the handout provided, tell me whether the product or service is counted or not counted; if it is not counted, tell me why.
What does GDP NOT tell us? • Will not tell us the composition of output • Does not display the quality of life
The Expenditures Approach • Finding GDP by calculating the total amount of expenditures within the economy. • Includes: • Consumer Expenditures (C) • Investments (by business) (Ig) • Government Expenditures (G) • Net Exports – Exports minus Imports (X – M) (Xn) • Which do you think makes up the largest amount towards GDP? Which makes up the least?
Inflation • A rise in the general price level of all goods and services; We must track inflation because it can distort all the numbers we look at when examining our economy; • For Example GDP (nominal GDP vs Real GDP): • Nominal Measured in current prices for a specific year; • Real adjusting prices to be constant for all products and services for all years; • Example: Top Grossing movies of all time
Economic Growth • Real GDP per capita the dollar amount of real GDP produced on a per person basis;
Standard of Living • The quality of life based on the possession of necessities and luxuries that make life easier;
Factors that Influence Economic Growth • The Quantity and quality of the Factors of Production (Land, Labor, Capital, and Entrepreneurship) • How efficiently these resources are used (Labor productivity the amount of output produced per unit of labor input)
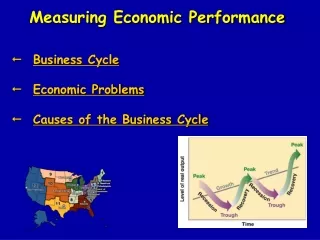
Business Cycles • The large systematic ups and downs of Real GDP; • Business Cycles are different from Business Fluctuations, which are the random moments of rise and fall of real GDP over time.
Causes of the Business Cycles • Capital Expenditures businesses will anticipate future sales with more investments, and there will come a point when businesses stop investing which will pull down GDP; • Inventory Adjustments Extra output left over will dictate how much businesses will adjust new output; • Innovation and Imitation new ideas and innovation will effect businesses abilities in production; • Monetary Factors the Fed desire to raise or lower interest rates which effect how much or little businesses will invest; • External Shocks Things outside our economy effect business production: war, weather, etc.
Two big problems we must deal with… • Unemployment • Inflation
Unemployment rate • The number of unemployed (people available for work who made a specific effort to find a job during the past month and who, during the most recent survey week, worked less than one hour for pay or profit) divided by the total number or person in the civilian labor force. • Limitations of the Unemployment Rate • Does not include people who are frustrated or discouraged and have stopped looking for jobs; people are not working and are not classified as unemployed; • People are considered employed even when they hold part-time jobs; employed is not the same as fully employed;
Inflation • A general rise in the over all price level, the relative magnitude of prices at one point in time; • Inflation is measured using a price index, or a group of products whose prices are averaged together to get a basic idea of all prices; allows us to not have to examine all products and their prices but just the average prices of the price index products. • Deflation a decrease in price level; • Degrees of Inflation: • Creeping Inflation around only 3% per year • Galloping Inflation intense inflation as high as 300% • Hyperinflation inflation the range of 500%
Poverty • The distribution of income is not always going to be equal and/or constant. • Reasons for income inequality: • Education – generally a strong relationship between income and education level • Wealth – inheritance • Discrimination – although illegal, still taken place • Ability – certain natural skills (athletes, movie stars, etc.) • Monopoly Power – power of control over incomes;
Poverty cont. • A relative measure that depends on prices, the standard of living, and the incomes that others earn. • 2012 Poverty Guidelines for the 48 Contiguous States and the District of Columbia Persons in family/household Poverty guideline • 1 $11,170 • 2 15,130 • 3 19,090 • 4 23,050 • 5 27,010 • 6 30,970 • 7 34,930 • 8 38,890 • For families/households with more than 8 persons, add $3,960 for each additional person.
Antipoverty Programs • Income Assistance providing cash assistance to those in need; Example is the Temporary Assistance for Needy Families (TANF) • General Assistance programs to help those in need without the direct transfer of cash; Example is Food Stamps. • Social Service Programs programs such as child abuse prevention, foster care, family planning, job trainings, etc; usually in the hands of states to determine their needs. • Tax Credits Low-income families get special tax benefits; • Enterprise Zones are areas where companies can locate free of some local, state, and federal tax laws and other operating restrictions.
Antipoverty Programs cont. • Workfare Programs programs that require welfare recipients to exchange some of their labor for benefits; Examples include helping law enforcement, sanitation, or highway crews. • Negative Income Tax proposed type of tax that would make cash payments to certain groups below the poverty line; a person would not end up paying taxes until they make at least $32,000 • Designed to encourage people to work, minimum payment is large enough to help but small enough to encourage work; • It would be cost-effective because it will take the place of other welfare programs.