Download
1 / 28
280 likes | 379 Vues
Statistics for Information Intensive Agriculture. A.P.Gore. S.A.Paranjpe. Indian economy Mainly agriculture based Heavily depends on monsoon. Past three decades Food grain production doubled (95 million tons to 180 tons). Country moved from food deficit state

E N D
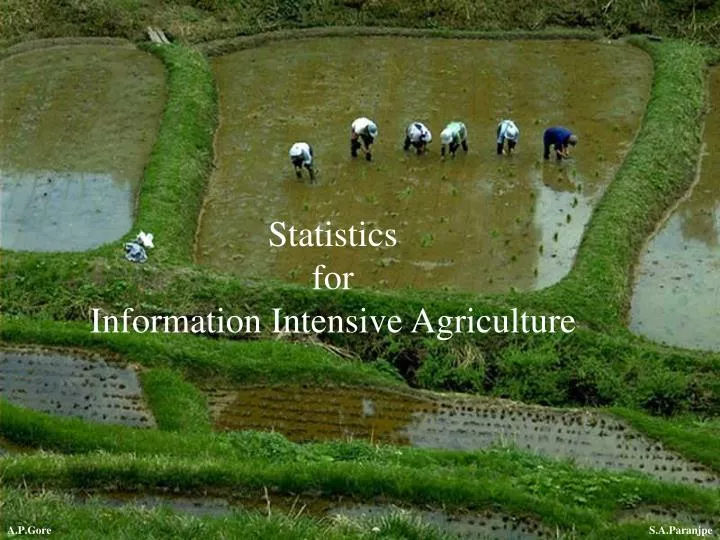
STATSPUNE Statistics for Information Intensive Agriculture A.P.Gore S.A.Paranjpe
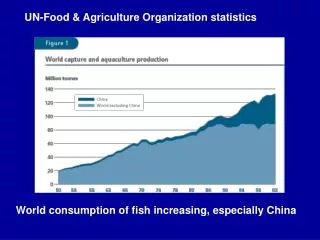
STATSPUNE Indian economy Mainly agriculture based Heavily depends on monsoon Past three decades Food grain production doubled (95 million tons to 180 tons) Country moved from food deficit state to essentially self sufficient state. How? A.P.Gore S.A.Paranjpe
STATSPUNE Green revolution: major factors High yielding varieties Chemical fertilizers Pesticides Irrigation All worked well till a decade ago Now food grain production has reached a plateau. Production growth not commensurate with population growth. Was green revolution an unmixed blessing? A.P.Gore S.A.Paranjpe
STATSPUNE Other side of the coin Spread of High yielding varieties loss of indigenous varieties Use of chemical fertilizer dependence on import Neglect of organic farming decline of soil fertility Use of pesticides poisoning of soil and water Irrigation water logging and increased salinity of farmlands Displacement of villagers Dam construction A.P.Gore S.A.Paranjpe
STATSPUNE Current focus Improvement in productivity of rain fed farming Means : choose varieties suitable to local conditions Fine tune management strategies: choice of sowing date – assured moisture avoidance of disease integrated pest control measures alternative cropping systems A.P.Gore S.A.Paranjpe
STATSPUNE Prerequisites for developing new management strategy Understanding relationship between crop development & weather fluctuations at micro level temperature, wind, rainfall etc. A.P.Gore S.A.Paranjpe
STATSPUNE Traditional rainfall analysis National level: yearly prediction Dry-wet spell: stochastic modeling Daily rainfall :ARIMA models Our approach: study weather fluctuations in the context of crop development at local level A.P.Gore S.A.Paranjpe
STATSPUNE Illustration Part I : Pest control Crop : ground nut Locality: Chitradurg district in Karnataka Question : How best to control Groundnut pest ‘leaf miner’ A thought experiment conducted using current farmers’ practices daily rainfall data A.P.Gore S.A.Paranjpe
STATSPUNE Current practices and knowledge of farmers A.P.Gore S.A.Paranjpe
STATSPUNE A Thought Experiment Year by year scrutiny of rainfall data: Is condition favorable for leaf miner attack? Rainfall data available for 84 years Dry spell of 15 days occurred in 58 years during ‘Peg formation phase’ Pest control strategy needed Should pesticide be sprayed immediately? Can one wait couple of days? Pest grows exponentially completely wipes out crop within 15 days What is the chance of getting corrective rains in time? A.P.Gore S.A.Paranjpe
STATSPUNE Distribution of # of days between leaf miner attack & corrective rains A.P.Gore S.A.Paranjpe
STATSPUNE X: number of days between leaf miner attack and corrective rains Probability distribution: geometric P(X=j) = p*q(j-1) j=1,2,… Est(p) = 0.14 Model fits well A.P.Gore S.A.Paranjpe
STATSPUNE Does the chance of corrective rains change with time of attack (days since beginning of Peg formation phase)? A.P.Gore S.A.Paranjpe
STATSPUNE Chance of nature cure of attack (by rains) Early attack: 5/18=28% Late attack: 23/40 = 58% Alternative strategy: wait for a correcting shower if attack is late and use pesticide if attack is early A.P.Gore S.A.Paranjpe
STATSPUNE Competing Strategies • Do not spray any pesticide • Spray as soon as attack occurs • Early attack : spray . Otherwise don’t • Wait up to X days for rains • If not then spray A.P.Gore S.A.Paranjpe
STATSPUNE Cost benefit analysisof 4 strategies Loss function L(j) = e.33*j j: number of days pest gets free hand L(j) =% crop lost up to j days L(j ) 100 % ; j 15 Chloropyrephos spray : 2 ml /lt ; 250 lt/acre Typical yield: 4 quintal / acre @ Rs. 1000/- a quintal Rs. 4000/- income if no attack Treatment cost Rs. 750/- per acre 18.75 % of gross income A.P.Gore S.A.Paranjpe
STATSPUNE Comparison of 4 Strategies (Chitradurg) A.P.Gore S.A.Paranjpe
STATSPUNE Wait and see strategy : best of 4 Saves more that 10% over strategy 1 6% over strategy 2 Will same strategy work at other locations also? Location : Anantpur District in Andhra Pradesh A.P.Gore S.A.Paranjpe
STATSPUNE Comparison of 4 Strategies (Anantpur) Wait and see continues to be the best A.P.Gore S.A.Paranjpe
STATSPUNE Part II: Fungus control Fungus attack on Peanut Dry spell: insect attack Wet spell: fungus attack A.P.Gore S.A.Paranjpe
STATSPUNE Fungus: Puccinia arachidis Initial appearance: Northern provinces of India 20 years ago Now covered 3/4th of the country Peninsular India likely to get hit in near future if things continue Potential loss: very heavy Farmers in Maharashtra switched to sunflower A.P.Gore S.A.Paranjpe
STATSPUNE Data: planned experiment 60 experimental units crop grown under varying weather conditions Fungus inoculated at plant age 40 days Response recorded: fungus severity every 10 days till plant age 120 days Weather records: Daily Max, Min temp , humidity, rainfall, sunshine hours A.P.Gore S.A.Paranjpe
STATSPUNE Analysis: Two stage Logistic model fitted to fungal growth for each unit Parameters r-growth rate and K- highest severity estimated relationship between parameters and weather studied First step : straight forward Second step: too many weather variables, only 60 data points. (120days X 5 weather parameters every day) Problem: how to choose ‘best’ subset? A.P.Gore S.A.Paranjpe
STATSPUNE Ad hoc method: 1. Fungus severity 10 days after inoculation one independent variable (reflects all weather effects till that time point & fungus not noticeable before this) 2. Take (say) Max temp for several days as regressors Choose a small subset 3. Repeat step 2 above for each weather variable 4. Combine selection- choose subset from this A.P.Gore S.A.Paranjpe
STATSPUNE Results: K(highest severity level attained) = f( severity on 10th day, sun-shine hours on 8 to 12 days, Max temp on 10th day, Min temp on 7th day) R2 = 80% A.P.Gore S.A.Paranjpe
STATSPUNE • Using the regression • When fungus noticed- • use temp and sunshine hours data • for 3 days before and 3 days after • predict max severity Max severity can be anticipated 6-7 weeks ahead of time. How is this useful? Agriculture experts see two uses prophylactic spray- timely scheduling making up micro/ macro nutrient deficiencies A.P.Gore S.A.Paranjpe S.A.Paranjpe
STATSPUNE Applicability: 1. Today these are ideas –untested 2. Solutions are location specific problem specific crop specific 3. Information on weather and crop development - essential A.P.Gore S.A.Paranjpe S.A.Paranjpe
STATSPUNE Summing up Statistical analysis of Crop growth Pest / fungus behavior weather pattern Opens up new possibilities of eco friendly pest / fungus control A.P.Gore S.A.Paranjpe