Download
1 / 73
740 likes | 1.03k Vues
Macroeconomics ECO 110/1, AAU Lecture 8. Deficits, surpluses and debt. Eva Hrom á dkov á , 12.4 2010. Budget Effects of Fiscal Policy. Keynesian theory highlights the potential of fiscal policy to solve macro problems.

E N D
Macroeconomics ECO 110/1, AAU Lecture 8 Deficits, surpluses and debt Eva Hromádková, 12.4 2010
Budget Effects of Fiscal Policy • Keynesian theory highlights the potential of fiscal policy to solve macro problems. • Fiscal Policy is the use of government taxes and spending to alter macroeconomic outcomes.
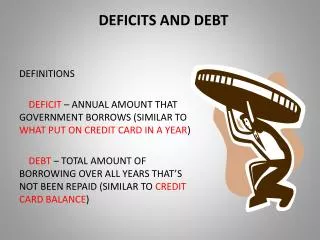
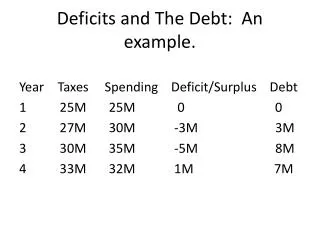
Budget Deficits and SurplusesDefinitions • Budget deficit is the amount by which government spending exceeds government revenue in a given time period. • Budget surplus is an excess of government revenues over government expenditures in a given time period. Budget deficit / surplus = gvt spending – tax revenues > /< 0
Keynesian View • Budget deficits and surpluses are a routine feature of counter-cyclical fiscal policy. • The goal of macro policy is not to balance the budget but to balance the economy at full-employment. LO1
Discretionary vs. Automatic Spending • At the beginning of each fiscal year, the government and parliament (Czech Republic) or President and Congress (US) put together a budget blueprint (proposal) for next fiscal year. • Fiscal year (FY)is the twelve-month period used for accounting purposes • In the Czech Rep, the same as calendar year • In US, begins on October 1 for the federal government. • After approval it is published as a bill (law)
Discretionary vs. Automatic Spending • To a large extent, current revenues and expenditures are the result of decisions made in prior years past legislative or executive commitments. • Q: Examples? • Roughly 80 percent of the budget is given by previous commitments, so that only about 20 percent represents discretionary fiscal spending. • Left to or regulated by gvt's own discretion or judgment. • Available for use as needed or desired LO1
Discretionary vs. Automatic Spending • Since most of the budget is uncontrollable, fiscal restraint or fiscal stimulus is less effective. Remember? • Fiscal restraint – tax hikes or spending cuts intended to reduce (shift) aggregate demand. • Fiscal stimulus – tax cuts or spending hikes intended to increase (shift) aggregate demand. LO1
Automatic StabilizersAutomatic budget fluctuations w.r.t. business cycle • Some items on the budget actually change with economic conditions, irrespectively of government plans. • Expenditure side: • Unemployment insurance benefits • Welfare benefits • Revenue side: • Income taxes (progressive even more) • Corporate taxes Stabilizing effect = countercyclical response to changes in national income (inject/withdraw spending power) LO1
Automatic Transfers • These income transfers act as automatic stabilizers. • Income transfers are payments to individuals for which no current goods or services are exchanged, such as social security, welfare, unemployment benefits. LO1
Automatic Transfers • Automatic stabilizers are federal expenditure or revenue items that automatically respond counter-cyclically to changes in national income.
Automatic Transfers • Automatic stabilizers also exist on the revenue side of the budget. • Income taxes move up and down with the value of spending and output. • Being progressive, personal taxes siphon off increasing proportions of purchasing power as incomes rise.
Cyclical Deficits • The size of the federal deficit or surplus is sensitive to expansion and contraction of the macro economy. • Actual budget deficits and surpluses may arise from economic conditions as well as policy. LO1
Cyclical Deficits • The cyclical deficit is that portion of the budget deficit attributable to unemployment or inflation. • The cyclical deficit widens when GDP growth slows or inflation decreases. • The cyclical deficit shrinks when GDP growth accelerates or inflation increases. LO1
Total budget deficit Cyclical deficit Structural deficit = + Structural Deficits • To isolate effects of fiscal policy, the deficit is broken down into cyclical and structural components. LO1
Structural Deficits • The structural deficit is federal revenues at full-employment minus expenditures at full employment under prevailing fiscal policy. LO1
Structural Deficits • Part of the deficit arises from cyclical changes in the economy. • The rest is the result of discretionary fiscal policy. • Only changes in the structural deficit measure the thrust of fiscal policy. LO1
Structural Deficits • Fiscal policy is categorized as follows: • Fiscal stimulus is measured by the increase in the structural deficit (or shrinkage in the structural surplus). • Fiscal restraint is gauged by the decrease in the structural deficit (or increase in the structural surplus). LO1
Economic Effects of Deficits • There are a number of consequences of budget deficits. • Crowding out. • Opportunity cost. • Interest-rate movements.
Crowding Out • Crowding-out is the reduction in private-sector borrowing (and spending) caused by increased government borrowing. • Crowding out implies less private-sector output. LO2
Public-sector output (quantity per year) Private-sector output (quantity per year) Crowding Out b g2 Increase in government spending . . . g1 a c Crowds out private spending h2 h1 LO2
Opportunity Cost • Crowding out reminds us that there is an opportunity cost to government spending. • Opportunity cost is the most desired goods or services that are forgone in order to obtain something else.
Interest-Rate Movements • Rising interest rates are both a symptom and a cause of crowding out.
Economic Effects of Surpluses • The economic effects of budget surpluses are the mirror image of those for deficits.
Crowding In • There are four potential uses for a budget surplus: • Spend it on goods and services. • Cut taxes. • Increase income transfers. • Pay off old debt (“save it”). LO2
Crowding In • Crowding in is the increase in private sector borrowing (and spending) caused by decreased government borrowing. LO2
Cyclical Sensitivity • Crowding in depends on the state of the economy. • In a recession, a decline in interest rates is not likely to stimulate much spending if consumer and investor confidence is low. LO2
The Accumulation of Debt • The United States has accumulated a large national debt. • The national debt is the accumulated debt of the federal government.
Debt Creation • When the Treasury borrows funds it issues treasury bonds. • Treasury bonds are promissory notes (IOUs) issued by the U.S. Treasury. • The national debt is a stock of IOUs created by annual deficit flows.
Early History, 1776-1900 • By 1783, the United States had borrowed over $8 million from France and $250,000 from Spain to finance the Revolutionary War.
Early History, 1776-1900 • During the period 1790-1812 the U.S. often incurred debt but typically repaid it quickly. • The War of 1812 caused a massive increase in national debt and, by 1816, the national debt was over $129 million.
Early History, 1776-1900 • 1835-36: Debt Free! – The U.S. was completely out of debt by 1835. • The Mexican-American War (1846-48) caused a four-fold increase in the debt.
Early History, 1776-1900 • By the end of the Civil War (1861-65), the North owed over $2.6 billion, nearly half of its national income. • After the South lost, Confederate currency and bonds had no value.
The Twentieth Century • The Spanish-American War (1898) also increased the national debt. • World War I raised the debt from 3% to 41% of the national income.
The Twentieth Century • National debt declined during the 1920’s but rose again during the Great Depression.
World War II • The greatest increase in national debt occurred during World War II. • Rather than raise taxes, the government rationed consumer goods. • U.S. War Bond purchases raised the debt from 45% of GDP to over 125% in 1946.
The 1980s • During the 1980s, the national debt rose by nearly $2 trillion. • The increase was not war-related but as a result of recessions, a military buildup, and massive tax cuts.
The 1990s • The early 1990s continued the same trend. • Discretionary federal spending increased sharply in the first two years of the Bush administration.
The 1990s • The 1988-92 period saw the national debt increased by another trillion dollars. • There was some success in reducing the structural deficit in 1993. • Budget deficits for 1993-96 have pushed the national debt to over $5 trillion.
2000 - • By 2002, the accumulated debt was $5.6 trillion. • By 2007, the debt approximated $9 trillion, which works out to nearly $30,000 of debt for every U.S. citizen.
World War II 1990-91 recession Bush tax cuts Great Depression Civil War World War I 1990-91 recession Historical View of the Debt/GDP Ratio
Who Owns the Debt? • Who can ever expect to pay off a debt measured in the trillions of dollars?
Liabilities = Assets • National debt represents an asset as well as a liability in the form of bonds. • Liability– An obligation to make future payment; debt. • Asset– Anything having exchange value in the marketplace; wealth.
Liabilities = Assets • The national debt creates as much wealth (for bondholders) as liabilities (for the U.S. Treasury).
Ownership of Debt • Federal agencies hold roughly 50 percent of the outstanding Treasury bonds. • State and local governments hold 7 percent of the national debt. • U.S. households hold nearly 20% of the national debt, either directly or indirectly.
Ownership of Debt • Internal debt is the U.S. government debt (Treasury bonds) held by U.S. households and institutions. • The external debt is U.S. government debt (Treasury bonds) held by foreign households and institutions.
Ownership of Debt Public Sector Federal agencies 24% Federal Reserve 9% Social Security 21% State and local governments 7% Foreigners 25% Internal debt 14% Foreigners Private Sector
Burden of the Debt • The burden of the debt is not so evident: • Refinancing. • Debt service. • Opportunity cost. LO3
Refinancing • The debt has historically been refinanced by issuing new bonds to replace old bonds that have become due. • Refinancing is the issuance of new debt in payment of debt issued earlier. LO3