Download
1 / 52
520 likes | 740 Vues
Project Scheduling. Class 4. Network formation Network Analysis Bar chart Resources. Free Powerpoint Templates. A project network is a tool used for planning, scheduling, and monitoring project progress.

E N D
Project Scheduling Class 4 Network formation Network Analysis Bar chart Resources Free Powerpoint Templates
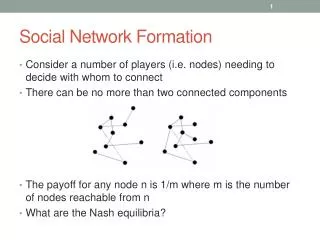
A project network is a tool used for planning, scheduling, and monitoring project progress. Network is a graphical representation of the project or part of it, showing all of the activities and their relationships. Network is developed from the information collected for the WBS. Network Formation
Activity: is an element of the project that requires time, may or may not require resources. Path: is a sequence of connected, dependent activities Critical Path: is the longest path(s) through the network, if an activity on the path is delayed, the project is delayed the same amount of time. Event: This term is used to represent a point in time when an activity is started or completed. It does not consume time. Predecessor: activity must be completed before Successor: activity must immediately follow it Definition
1 3 5 START 2 4
Networks flow typically from left to right. An activity cannot begin until all preceding connected activities have been completed. Arrows on networks indicate precedence and flow. Arrows can cross over each other. Each activity should have a unique identification number. Basic rules in developing project network 13 15
5. An activity identification number must be larger than that of any activities that precede it. 2 3 6 1 8 4 5 7 2 4 6 1 8 3 5 7
6. Looping is not allowed. 7. Condition statements are not allowed. 8. When there are multiple starts, a common start node can be used to indicate a clear project beginning on the network. Dummy A Y Dummy B Z
There are 2 types:- Activity-on-Arrow (AOA) / Arrow Diagram Activity-on-Node (AON) / Precedence Diagram Project Networks
The arrow diagram represents an individual project activity that requires time. Arrow diagrams were the first form of network diagram to be developed. The length and slope of the arrow diagram have no significance. Arrow Diagrams
Activities and Events Activities are represented by arrows starting and terminating at nodes or events. START FINISH ACTIVITY
Predecessor-Successor Relationships Time relationships between activities is indicated by connecting activities through events. ACTIVITY2 ACTIVITY1 ACTIVITY3 ACTIVITY1 ACTIVITY2 (2 sources)
Concurrence Relationships Some activities can be performed at the same time, referred to as concurrent activities. ACTIVITY1 ACTIVITY2
Dummy Activities Sometimes the logic of the operation cannot be adequately described using only real activities and dummy activities need to be created. ACTIVITY3 ACTIVITY1 ACTIVITY4 ACTIVITY2
ACTIVITY1 • Dummy activities have no duration, cost nothing, and use no resources. • Dummy activities are normally drawn using dotted lines. ACTIVITY2
Artificial Activity An artificial activity is used to create a delay. It has a duration, but no cost or resources. Circuits As such circuits or loops are not possible, should avoid.
Aggregated Activity Occasionally it is conventional to group a collection of activities and replace this group with a single activity. F B E H A C D G
In this diagram the nodes represent the activities and the arrows give the precedence relationships between them. Widely availability if personal computers and graphics programs Precedence Diagrams
AOA to AON A B A D B E C
A B D C A B C D
C A B D
AOA method Advantages: Path tracing is simplified by activity/event numbering scheme AOA is easier to draw if dependencies are intense Key events or milestones can easily be flagged Disadvantages: Use of dummy activities increases data requirements Emphasis on events can distract from activities Comparison of AON and AOA
AON method Advantages: No dummy activities are used Events are not used AON is easy to draw if dependencies are not intense Activity emphasis is easily understand by first-level managers Disadvantages: Path tracing by activity number is difficult Network drawing and understanding are more difficult when dependencies are numerous
The Critical Path is the minimum time that it takes to complete a project is the longest sequence of activities in the network There maybe more than one critical path through a network; but one is better The activities that lie along critical path are called critical activities If a critical activity is delayed then the whole project is delayed Network Analysis
15 15 20 10 30 10 25 5 How long does it take to finish this project? Where is critical path?
Case#8 Critical Path A city requests federal funding for a par-and-ride project. Network plan is to be submit. Make the critical path.
EST – earliest start time LST – latest start time EFT – earliest finish time LFT – latest finish time TF –Total float FF – Free float IF – Interfering float Analysing Network
Earliest times: are the earliest times that an activity can start and finish given that all preceding activities as soon as possible Latest times: are the latest that an act can start and finish and still allow time for succeeding activities to be completed without holding up the project TF = LST-EST = LFT – EFT is the amount of time that an act can be delayed without effecting the overall duration Critical path; TF = 0
FF: is the amount of time that an activity can be delayed without affecting any other activity IF = TF –FF will affect succeeding activities but not the total project duration 10 20 20
EST EFT LST LFT FF TF 10 10 15 20 10
EST EFT LST LFT FF TF 15 20 10 20 20 30
Also known as a Gantt bar chart Gives a pictorial representation of when the activities begin, when they end, how long they take and how much float they have Bar charts
Overlapping relationships Preceding Activity Following Activity Start to Start S/S Start to Finish S/F F/S Finish to Start F/F Finish to Finish • Length of the arrows represents the lead times (LT) • Overlapping makes project faster
Resources are the things that are needed to carry out project activities Main resources:- Man – workers, Engineers, Proj. Man. Machine – pumps, cranes Materials – steel, pipe, bolts&nuts Why manage resources:- 1. Resource Constrained Scheduling 2. Resource Leveling RESOURCES
Limited resources Sometimes resources are restricted; some activities need to be delayed because of not enough resources Where schedule is constrained by the available resources and may have to increase the duration of the project 1. Resource Constrained Scheduling
Reasons for resource limited: Space constraints Limited facilities Safety requirements limit Limited amount of equipment to work on Solutions: Working overtime Working shifts Training, education, automation = increase productivity Learning curve = repetitive Hire sub-contractors Reduce scope of work
Resources Resource limited Extend Project duration Time
Hiring & Firing Resources cost money even though no work is being done A uniform resource usage will prevent resources being idle and to minimize hiring and firings Safety, learning curve, skilled workers, happy, lower price, more work, more profit Duration of project is limited No one approach is accepted as the best 2. Resource Leveling
Resources Time limited Time • Rearrange activities within project duration • Moving activities around in order to smooth the resource profile
B A D C 3days, 2men 5days, 3men 5days, 2men 4days, 4men
Draw an arrow diagram Analyze network giving EST, EFT, LST, LFT, FF and TF Construct a resource profile Assuming that you only have 6 units of resource; reschedule the activities to fit the resource limitations Example