Download
1 / 28
280 likes | 410 Vues
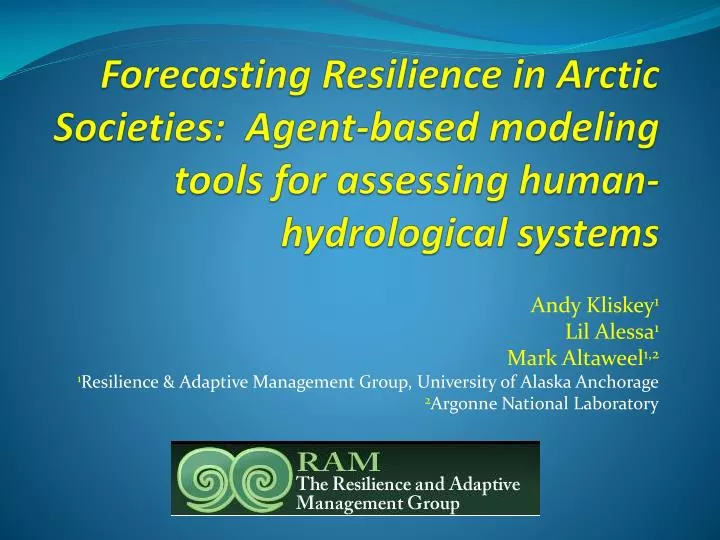
Forecasting Resilience in Arctic Societies: Agent-based modeling t ools for a ssessing human-h ydrological s ystems. Andy Kliskey 1 Lil Alessa 1 Mark Altaweel 1,2 1 Resilience & Adaptive Management Group, University of Alaska Anchorage 2 Argonne National Laboratory. Era of rapid change.

E N D
Forecasting Resilience in Arctic Societies: Agent-based modeling tools for assessing human-hydrological systems Andy Kliskey1 Lil Alessa1 Mark Altaweel1,2 1Resilience & Adaptive Management Group, University of Alaska Anchorage 2Argonne National Laboratory
Era of rapid change 1985 1995 (Credit: David Verbyla, UAF)
(Credit: Bunn, EOS) (Credit: USGS)
Era of rapid change (Credit: AAAS) (Credit: EALAT, Inger Marie Gaup EIRA)
Complex dynamics – social & ecological systems, spatial and temporal scales
ABM defined … • A computational model for simulating the actions and interactions of individuals in a network … • with a view to examining their effects on the entire system
Values held toward water Source: Alessa , Kliskey, Williams. Society & Natural Resources. 2008.
9 35.0 8 33.0 7 31.0 6 29.0 5 27.0 Aggregated perception of change for age groups Mean annual temperature (deg F) 4 25.0 3 23.0 2 21.0 1 19.0 0 17.0 1915 1920 1925 1930 1935 1940 1945 1950 1955 1960 1965 1970 1975 1980 1985 1990 1995 2000 Year Perceived change vs Actual change
Perception of change in water availability correlated with presence/absence of MWS • People from villages with no MWS perceive greater change in river water availability • Chi-square = 6.01, p<0.01 • Source: Alessa, Kliskey, Williams. Polar Geography 2007.
Some rules … • Perception of change in water resources varies with age cohort • Values toward water vary with age cohort • Perception of change in water availability vary with presence of MWS • Perception of change in water resources varies by agent type
Human-hydrological dynamics: Integrating Multiple ApproachesFERAL: Forecasting Environmental Resilience of Arctic Landscapes
Different Approaches – Seward Peninsula Scenarios • Metropolis-Hastings Markov Chain • Discharge data (USGS) • Demographic Life Tables • Data from US Census and Alaska’s Department of Health and Social Services • Water Use Model • Data from Seward Peninsula fieldwork
Initial Social Model Current Social ABM in FERAL Step 1: Assess water source selection process with observed trends and determine consequences of water selection choices.
Questions- White Mountain (Seward Peninsula) Scenarios • How do agents choose water source locations? • What are the consequences of agent decisions? • What social-ecological changes are suggested by water use of different sources?
Integrated Models: Example Runtime Output 1 Discharge: Model uses Metropolis-Hasting Markov chain to calculate discharge levels at a given time.
Integrated Models: Example Runtime Output 2 Maximum River Discharge Mean Quantity change belief
Integrated Models: Example Runtime Output 3 Population changes slowly, based on demographic trends in Alaska and Seward Peninsula
10-Year Scenario: Travel To River Fish River agents White Mountain Agents concentrate at river sources nearest to White Mountain.
10-Year Scenario: Selection of Sources in the Fish River Observed matches well with expected
Noticeable shift toward older agents using municipal sources. 10-Year Scenario: Municipal and Non-Municipal Choices 1=Beginning of the simulation 2= End of the simulation
100-Year Scenario: Declining Use of River Sources • River sources are abandoned between 19-45 years • Average abandonment time for the river is 36 years
100-Year Scenario: Water Use and Population Rapid increase in municipal water use
Social-Ecological Changes • Still not clear from the modeling (more work needed here). • We expect greater use of municipal systems to create greater strain on the sources providing municipal systems. Considering the small population, this might not be very significant; however, other more intensive water use operations could alter water quality and quantity availability (e.g., mining). • Fast changing social and land use dynamics (e.g., construction of municipal system) vs. slower climate driven phenomena (e.g., permafrost thawing).
Conclusions • Social-Ecological problems can be addressed by coupling different processes using various methodologies at different spatiotemporal scales. • In addition to addressing regional level dynamics, resilience approaches need to begin to assess small-scale (e.g., community-level) dynamics. • Need for integrating interdisciplinary research teams. • Close collaboration between modeling and fieldwork can enable better overall results.