Download
1 / 1
10 likes | 120 Vues
HCS 149. ISATEC. Fig 1 Biomass distribution among sub-areas. Fig2. Area of the continental shelf with oxygen level higher than 0.5ml/L Green line 1985, red line 2001. Materials and Methods Biomass species composition Data source : surveys 1985-03-04, 2001-05-06

E N D
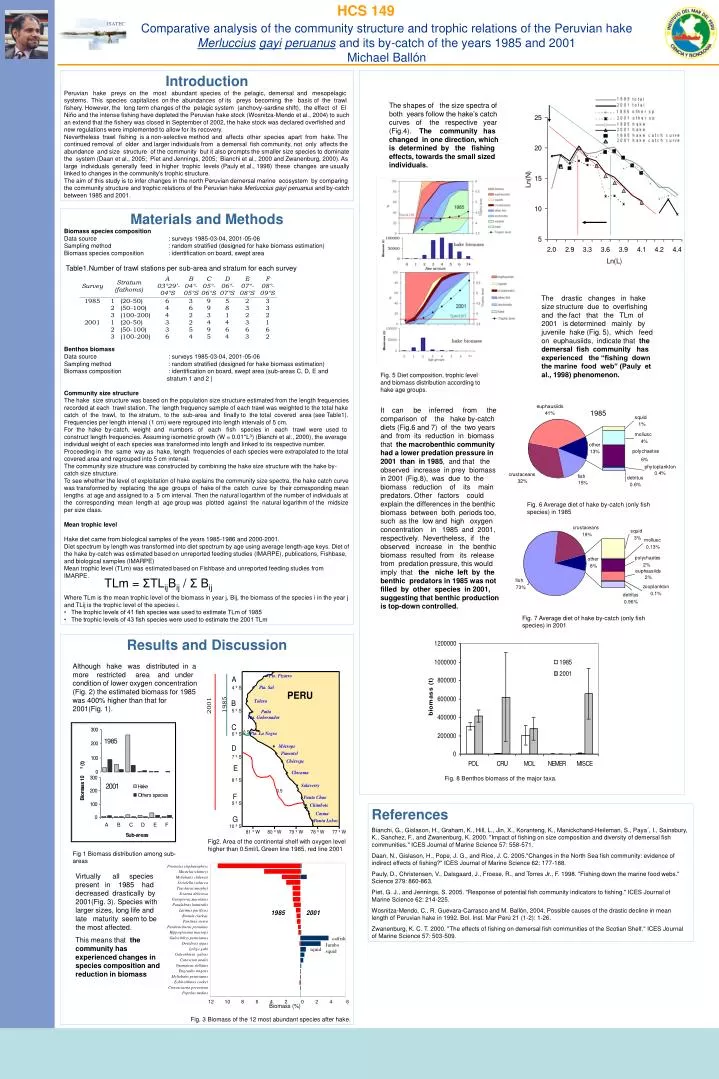
HCS 149 ISATEC Fig 1 Biomass distribution among sub-areas Fig2. Area of the continental shelf with oxygen level higher than 0.5ml/L Green line 1985, red line 2001 Materials and Methods Biomass species composition Data source : surveys 1985-03-04, 2001-05-06 Sampling method : random stratified (designed for hake biomass estimation) Biomass species composition : identification on board, swept area Table1.Number of trawl stations per sub-area and stratum for each survey Benthos biomass Data source : surveys 1985-03-04, 2001-05-06 Sampling method : random stratified (designed for hake biomass estimation) Biomass composition : identification on board, swept area (sub-areas C, D, E and stratum 1 and 2 ) Community size structure The hake size structure was based on the population size structure estimated from the length frequencies recorded at each trawl station. The length frequency sample of each trawl was weighted to the total hake catch of the trawl, to the stratum, to the sub-area and finally to the total covered area (see Table1). Frequencies per length interval (1 cm) were regrouped into length intervals of 5 cm. For the hake by-catch, weight and numbers of each fish species in each trawl were used to construct length frequencies. Assuming isometric growth (W = 0.01*L3) (Bianchi et al., 2000), the average individual weight of each species was transformed into length and linked to its respective number. Proceeding in the same way as hake, length frequencies of each species were extrapolated to the total covered area and regrouped into 5 cm interval. The community size structure was constructed by combining the hake size structure with the hake by-catch size structure. To see whether the level of exploitation of hake explains the community size spectra, the hake catch curve was transformed by replacing the age groups of hake of the catch curve by their corresponding mean lengths at age and assigned to a 5 cm interval. Then the natural logarithm of the number of individuals at the corresponding mean length at age group was plotted against the natural logarithm of the midsize per size class. Mean trophic level Hake diet came from biological samples of the years 1985-1986 and 2000-2001. Diet spectrum by length was transformed into diet spectrum by age using average length-age keys. Diet of the hake by-catch was estimated based on unreported feeding studies (IMARPE), publications, Fishbase, and biological samples (IMARPE) Mean trophic level (TLm) was estimated based on Fishbase and unreported feeding studies from IMARPE. Where TLm is the mean trophic level of the biomass in year j, Bij, the biomass of the species i in the year j and TLij is the trophic level of the species i. • The trophic levels of 41 fish species was used to estimate TLm of 1985 • The trophic levels of 43 fish species were used to estimate the 2001 TLm 1985 Fig. 6 Average diet of hake by-catch (only fish species) in 1985 TLm = ΣTLijBij / Σ Bij Fig. 7 Average diet of hake by-catch (only fish species) in 2001 Fig. 8 Benthos biomass of the major taxa. Comparative analysis of the community structure and trophic relations of the Peruvian hake Merlucciusgayiperuanusand its by-catch of the years 1985 and 2001Michael Ballón Introduction Peruvian hake preys on the most abundant species of the pelagic, demersal and mesopelagic systems. This species capitalizes on the abundances of its preys becoming the basis of the trawl fishery. However, the long term changes of the pelagic system (anchovy-sardine shift), the effect of El Niño and the intense fishing have depleted the Peruvian hake stock (Wosnitza-Mendo et al., 2004) to such an extend that the fishery was closed in September of 2002, the hake stock was declared overfished and new regulations were implemented to allow for its recovery. Nevertheless trawl fishing is a non-selective method and affects other species apart from hake. The continued removal of older and larger individuals from a demersal fish community, not only affects the abundance and size structure of the community but it also prompts the smaller size species to dominate the system (Daan et al., 2005; Piet and Jennings, 2005; Bianchi et al., 2000 and Zwanenburg, 2000). As large individuals generally feed in higher trophic levels (Pauly et al., 1998) these changes are usually linked to changes in the community’s trophic structure. The aim of this study is to infer changes in the north Peruvian demersal marine ecosystem by comparing the community structure and trophic relations of the Peruvian hake Merluccius gayi peruanus and by-catch between 1985 and 2001. The shapes of the size spectra of both years follow the hake’s catch curves of the respective year (Fig.4). The community has changed in one direction, which is determined by the fishing effects, towards the small sized individuals. The drastic changes in hake size structure due to overfishing and the fact that the TLm of 2001 is determined mainly by juvenile hake (Fig. 5), which feed on euphausiids, indicate that the demersal fish community has experienced the “fishing down the marine food web” (Pauly et al., 1998) phenomenon. Fig. 5 Diet composition, trophic level and biomass distribution according to hake age groups. It can be inferred from the comparison of the hake by-catch diets (Fig.6 and 7) of the two years and from its reduction in biomass that the macrobenthic community had a lower predation pressure in 2001 than in 1985, and that the observed increase in prey biomass in 2001 (Fig.8), was due to the biomass reduction of its main predators. Other factors could explain the differences in the benthic biomass between both periods too, such as the low and high oxygen concentration in 1985 and 2001, respectively. Nevertheless, if the observed increase in the benthic biomass resulted from its release from predation pressure, this would imply that the niche left by the benthic predators in 1985 was not filled by other species in 2001, suggesting that benthic production is top-down controlled. Results and Discussion Although hake was distributed in a more restricted area and under condition of lower oxygen concentration (Fig. 2) the estimated biomass for 1985 was 400% higher than that for 2001(Fig. 1). References Bianchi, G., Gislason, H., Graham, K., Hill, L., Jin, X., Koranteng, K., Manickchand-Heileman, S., Paya´, I., Sainsbury, K., Sanchez, F., and Zwanenburg, K. 2000. "Impact of fishing on size composition and diversity of demersal fish communities." ICES Journal of Marine Science 57: 558-571. Daan, N., Gislason, H., Pope, J. G., and Rice, J. C. 2005."Changes in the North Sea fish community: evidence of indirect effects of fishing?" ICES Journal of Marine Science 62: 177-188. Pauly, D., Christensen, V., Dalsgaard, J., Froese, R., and Torres Jr., F. 1998. "Fishing down the marine food webs." Science 279: 860-863. Piet, G. J., and Jennings, S. 2005. "Response of potential fish community indicators to fishing." ICES Journal of Marine Science 62: 214-225. Wosnitza-Mendo, C., R. Guevara-Carrasco and M. Ballón, 2004. Possible causes of the drastic decline in mean length of Peruvian hake in 1992. Bol. Inst. Mar Perú 21 (1-2): 1-26. Zwanenburg, K. C. T. 2000. "The effects of fishing on demersal fish communities of the Scotian Shelf." ICES Journal of Marine Science 57: 503-509. Virtually all species present in 1985 had decreased drastically by 2001(Fig. 3). Species with larger sizes, long life and late maturity seem to be the most affected. This means that the community has experienced changes in species composition and reduction in biomass catfish Jumbo squid squid 12 10 8 6 4 2 0 2 4 6 Fig. 3 Biomass of the 12 most abundant species after hake.