Download
1 / 2
20 likes | 216 Vues
LOM coupler HFSS modeling. Green line in the plot corresponds to initial I-DEAS design. One of the resonances has too low frequency, another resonance is too narrow. Notch frequency 3200 MHz is too low, should be 3900 MHz.

E N D
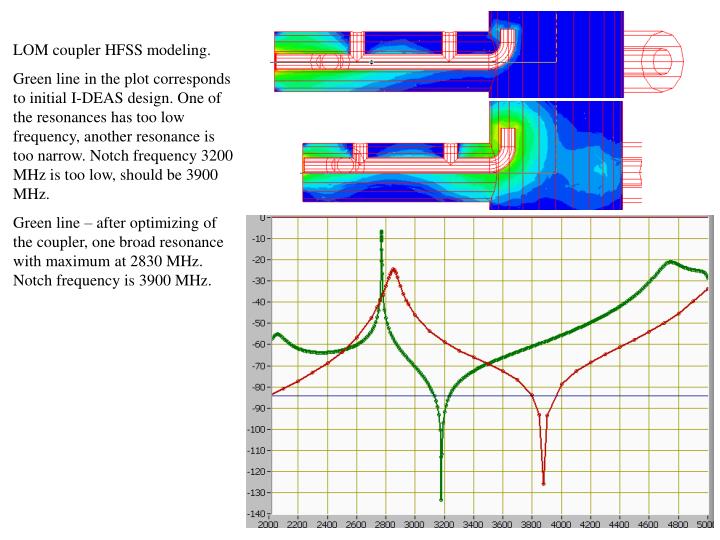
LOM coupler HFSS modeling. Green line in the plot corresponds to initial I-DEAS design. One of the resonances has too low frequency, another resonance is too narrow. Notch frequency 3200 MHz is too low, should be 3900 MHz. Green line – after optimizing of the coupler, one broad resonance with maximum at 2830 MHz. Notch frequency is 3900 MHz.
F=2702.3 Q=697 HFSS model was build from I-DEAS surface mesh file. This mesh file from Don. He extract it from optimized model. Both resonances close to design frequency of 2830 MHz. Notch frequency is 4100 MHz. All resonances in final tuning range. F=2945