Download
1 / 19
190 likes | 307 Vues
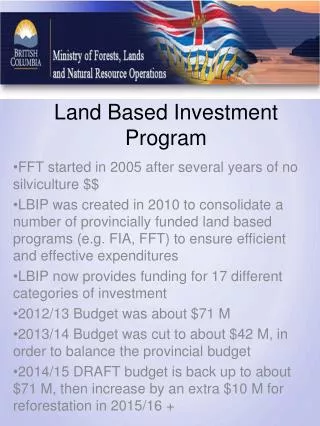
Section 2 Land Based Investment. Al Powelson & Kelly Osbourne. 5 Year Plan Summary - Current Reforestation PL 116M Trees, Sow 122M Total BCTS PL 39M and Sow 34M SU 150k ha WF and 126k ha MPB Ramping from $19.2M to $25M operational per year 25M trees per year

E N D
Section 2 Land Based Investment Al Powelson & Kelly Osbourne
5 Year Plan Summary - Current Reforestation • PL 116M Trees, Sow 122M Total • BCTS PL 39M and Sow 34M • SU 150k ha WF and 126k ha MPB • Ramping from $19.2M to $25M operational per year • 25M trees per year • Not including $5M for Sowing per year and $1.5M for Admin and Roads plus HQ Support and other programs • Total $150M over 5 years
12/13 CR BCTS FFT _ ITSLs $4.4M operational PL 6M trees and sow 7.2M SP 2800 ha • $26M / $19.3M operational • PL 14M trees and Sow 25M • SU 46,000 MPB • SU 26,000 WF • 20,000 ha Backlog SU • SP 7,333 ha ground
14/15 CR BCTS FFT _ ITSLs $4.4M operational PL 7.6M trees and sow 7.1M SP 1500 ha • $29.5M / $22.8M operational • PL 24.7M trees and Sow 26.1M • SU 26,400 MPB • SU 25,200 WF • 2,600 ha Backlog SU • SP 6,257 ha ground
5 Year Plan Summary –Timber Supply Mitigation • Fertilize 166k ha total • Fertilize 2012 - 27,000 to 35,000 ha - 2016 • Space 43,000 ha per year • Space 2012 - 5450 ha to 11,080 ha 2016 • SU 346,000 ha • Ramping from $19M to $28M operational per year • Not including $7M for Fertilizer per year average • Total $120M over 5 years
Timber Supply Mitigation 12/13 $18.8M • Fertilize 27,500 ha • 8030 ha Coast 29% • 19,488 ha Interior 71% • Space 5,450 ha total • 955 ha SCoast, 1275ha SKR, • 2400 ha CR ( around 50%) • SU 166,000 ha ? $3.7M update Silv Strat TFL 53 • Not including $6M for Fertilizer per year 1:1 ratio
Timber Supply Mitigation 14/15 $25.2M • Fertilize 34,660 ha 21% increase • 11030 ha Coast 32% • 23,630 ha Interior 68% • Space 9,555 ha total 43% increase • 2900 ha S/W Coast, 2000ha SKR, • 3500 ha CR ( around 50%), 500 TOR/KBR • SU 52,920 ha • Not including $6M for Fertilizer per year 1:1 ratio
Kootenay Boundary Region $250,000 to $1M per year WF SU 6200 total all 5 years PL 1M trees over 5 years Spacing 2000 ha over 5 years (WF repressed) $7.2M over 5 years Average $1.5M
Thompson Okanagan Region CR $4.7M to $1.3M per year $14.8M plus 5.6M Sowing and support MPB SU 14,425 ha, WF 7,900ha 6,340 ha site prep 17,888 ha stand maintenance PL 5.3M trees to 1.5M per year total 18M PL but 10.2M sowing shows a ramp down BCTS total 10.6M Pl and 4.3M sow TSM 8,590 ha FERT and 2,945 ha SPACE
Caribou Region CR $4.2M to $9.76M per year $38M plus $13M sowing and support MPB SU 25,676 ha, WF 62,070 ha 9,350 ha site prep PL 3.5M trees to 13.7M per year total 48.8M PL but 59M sowing shows a ramp up BCTS total 19.9M Pl and 23.5M sow ramp up TSM 23,500 ha FERT and 16,900 ha SPACE total
Skeena Region CR $2.7M to $5.7M per year $20.1M plus $3.5M sowing and support MPB SU 30,711 ha, WF 22,500ha 8,718 ha Site prep PL 1.0M trees to 2.8M per year total 10M PL but 14.6M sowing shows a ramp up BCTS TSM 38,000 ha FERT and 9,006 ha SPACE
Omineca Region CR $5.8M to $8.0M per year $39.8M plus $8.9M sowing and support MPB SU 76,057ha, WF 25,406ha 12,430 ha Site prep PL 3.4M trees to 7.1M per year total 36M PL but 35M sowing shows a steady state BCTS total 8.8M PL and 6.9M sow TSM 46,163 ha FERT
North East Region CR $1.4M to $122,524 per year $1.9M plus $598,982 sowing and support MPB SU 2000ha, WF 200ha 1,149 ha Site prep Total 1.8M PL but 2.1M sowing shows a ramp down BCTS limited TSM none
West Coast Region Very little CR $162,000 total MPB SU 1310 total all 5 years PL 158,000 trees over 5 years TSM $24M Spacing 6900 ha (1800 ha per year ) Fertilization 37,750 ha (8000 ha per year)
South Coast Region Very little CR $54,000 total MPB SU 620 total all 5 years PL 36,000 trees over 5 years TSM $14.2M Spacing 5450 ha (1200 ha per year ) Fertilization 13,900 ha (3000 ha per year)
Appendix 2- Land Base Investment Strategy Operational Budget (salaries excluded)
Questions to be asked under Filter 2: • Will investment in the management unit result in a significant impact on mitigating the timber supply issue being addressed? • Will investment on the specific areas to be treated return a substantial return on investment? • Will investment in the management unit provide significant employment benefits on a local, regional, or provincial basis?
Additional questions: • What is the balance between incremental and current reforestation? • What is the role of BCTS and how can we maximize the benefit of this partnership? • Where do we have opportunity for treatment but little impact on future timber supply? • What is the priority fires or insect/disease/wind damaged stands? • What else do we need to consider?