Download
1 / 33
330 likes | 527 Vues
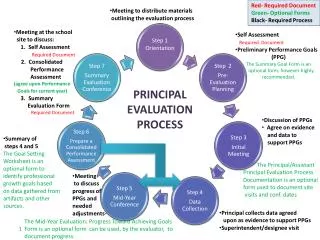
Mississippi Principal Evaluation System (MPES). CTE Goal Setting August, 2013. MPES Components. Circle Survey 30%. Setting MPES Year 1 & 2 Goals. Schoolwide goals - Based on statewide tests (i.e., MS-CPAS2) Increase in average MS-CPAS2 scores for year 1 students MPES Forms 2A and 2B.

E N D
Mississippi Principal Evaluation System (MPES) CTE Goal Setting August, 2013
MPES Components Circle Survey 30%
Setting MPES Year 1 & 2 Goals • Schoolwide goals - Based on statewide tests (i.e., MS-CPAS2) • Increase in average MS-CPAS2 scores for year 1 students MPES Forms 2A and 2B
Setting MPES Organizational Goals • 1st Goal: Tied to school wide goals • Enrollment • Improve program ranking statewide • 2nd Goal: Intended to target each school’s area in greatest need of improvement:leading/lagging indicators • Attendance, discipline, placement, dual-credit • Student org participation
Data Review • Start by reviewing all of your MS-CPAS2 reports for FY13 • Review and understand the reports • Share with your teachers • Look back a couple of years • Gather other supporting data: • MCT2 scores, SATP2 scores
Gathering Data for Goal Setting • Start with reports named • 0000_SP13_District Report • SP13-SEC State District Ranking by District • District report has the detail program data you need • State District Ranking is good summary of program with ranking in the state
Finding Reports Online • You may want a login • Go to RCU page; upper right corner look for REGISTER
Register • Complete registration form selecting your OWN username and password • REMEMBER IT • EMAIL Betsey (betsey.smith@rcu.msstate.edu) to tell her you have registered; what your username is now; and that as a director you would like access to MS-CPAS2 reports
How do I go from data reports to MPES forms? Mean Program Score Percent/Number
STEP 1 • START WITH A SPREADSHEET • Download Spreadsheet Template from Canvas • Download from RCU website (MDE/MPES page) • List your Programs
STEP 3 • Pull state averages and district rankings from the State District Ranking by District
STEP 4 • Fill in Mean (Average) Scores from your District Report • Find LOW and HIGH Mean Scores
How do I go from data reports to MPES forms? Mean Program Score Percent/Number 6 49 83 16 4 15 47 Data from 6 programs
STEP 5 Think about GOALS
STEP 6– Year 1 Goals Think about a reasonable increase in AVG Score by program
STEP 7 – Year 2 Goals Think about a reasonable increase in AVG Score by program
STEP 8 Think about COHORTS of student and the goals
STEP 8 Think about COHORTS of student and the goals
How do I go from data reports to MPES forms? Mean Program Score Percent/Number 6 49 83 16 4 15 47 Data from 6 programs Increase year 2 student program average from 67.8 to 74.8
Organization Goals Related to overall center performance Related to overall center performance
Organizational Goals • Increase participation rates in student organizations from 65% to 75% • Increase retention from year-1 to year-2 from 30% to 40% • Increase student attendance rate from 80% to 90% • Increase enrollment in year-1 by 20%
Organization Goals Retention rate from year 1 to year 2 is only 34% Related to overall center performance Only 50% of our students are active in student orgs Increase Year 1 to Year 2 retention from 34% to 40%; 8 more students Related to overall center performance Increase from 50% to 60% participation in student orgs
Summary • Gather reports needed to pull useful data • Download or create a simple spreadsheet to help you summarize and visualize your data for year 1 and year 2 • Decide on reasonable improvement goals • Consider COHORTS of children • Decide on organization goals • Complete forms, visit with superintendent • Upload forms