Download
1 / 138
1.39k likes | 1.61k Vues
Electrocardiography. Dr.S Kesanakurthy Reviewed by Dr. Michael Jacobson. A Sequential Approach to Reading EKG’s:. A Sequential Approach to Reading EKG’s:. Gain familiarity with the "normal" EKG. Evaluate the rhythm.

E N D
Electrocardiography Dr.S Kesanakurthy Reviewed by Dr. Michael Jacobson
A Sequential Approach to Reading EKG’s: A Sequential Approach to Reading EKG’s: • Gain familiarity with the "normal" EKG. • Evaluate the rhythm. • It is best to evaluate rhythm on a rhythm strip. If this is not available, look at "pieces" of the rhythm in each lead (II and V1 generally have prominent P waves). • Determine if the rhythm is regular or irregular. • For irregular rhythms determine if the rhythm is completely irregular ("irregularly irregular") or if the irregularity is caused by additional or dropped complexes superimposed on an underlying regular rhythm. • For all rhythms, look for and evaluate P waves in the underlying rhythm first, and then in relation to any additional or dropped beats • Look at QRS complex morphology, first in the underlying rhythm and then in any additional beats. • At each step consider the two main questions of rhythm interpretation: where has impulse formation occurred and how has conduction proceeded.
A Sequential Approach to Reading EKG’s: 3. Calculate rate and axis. Measure intervals. Consider the diagnostic possibilities suggested by abnormalities found, but do not make final diagnoses yet (except for left bundle branch block, which makes further interpretation impossible). 4. Evaluate each P wave, QRS, ST segment, T wave and U wave in the following lead order: I and aVL then II, III, and aVF then V1, V2, V3, V4, V5 and V6 (beginning with R wave progression), localizing and grouping all abnormalities. 5. Arrive at final diagnoses by critically evaluating each abnormality in relationship to all others and any available clinical data.
Orientation of the 12 Lead ECG: Right Left Superior Inferior Anterior Posterior • It is important to remember that the 12-lead ECG provides spatial information about the heart's electrical activity in 3 approximately orthogonal directions: Each of the 12 leads represents a particular orientation in space, as indicated below (RA = right arm; LA = left arm, LF = left foot) Bipolar limb leads (frontal plane): Lead I: RA (-) to LA (+) (Right Left, or lateral) Lead II: RA (-) to LF (+) (Superior Inferior) Lead III: LA (-) to LF (+) (Superior Inferior) Augmented unipolar limb leads (frontal plane): Lead aVR: RA (+) to [LA & LF] (-) (Rightward) Lead aVL: LA (+) to [RA & LF] (-) (Leftward) Lead aVF: LF (+) to [RA & LA] (-) (Inferior) Unipolar (+) chest leads (horizontal plane): Leads V1, V2, V3: (Posterior Anterior) Leads V4, V5, V6:(Right Left, or lateral)
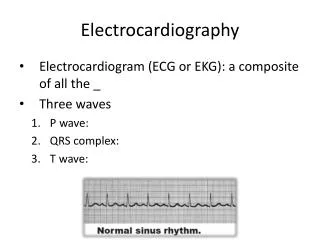
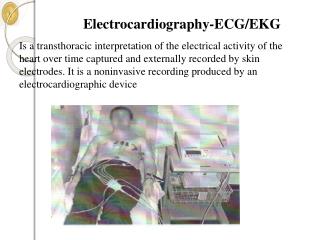
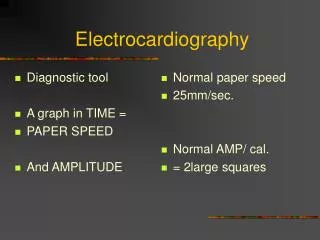
normal ECG ST segment • The normal ECG has the following features: • P wave - due to atrial depolarization • PR interval (due to delayed conduction through the AV node) 0.12 - 0.20 seconds • QRS complex - due to ventricular depolarization • T wave due to ventricular repolarization
normal ECG • The P wave represents atrial activation • the PR interval is the time from onset of atrial activation to onset of ventricular activation. (from the sinus node to the His Bundle purkinje fibers) • The QRS complex represents electrical ventricular activation; the QRS duration is the duration of ventricular activation. • The ST-T wave represents ventricular repolarization. • The QT interval is the duration of ventricular activation and recovery. • The U wave probably represents "after-depolarization" in the ventricles.
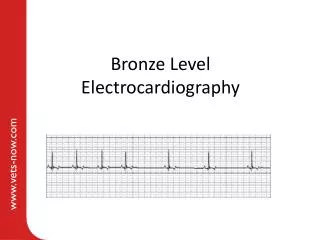
Normal Sinus Rhythm • A normal sinus rhythm one would expect the following: • an ECG with P waves • a PR interval of 0.12 - 0.20 seconds • a regular interval between each QRS complex (R-R interval) of 0.60 - 1.0 secs • a distinct a wave in the CVP trace due to atrial contraction • there may be minor regular variation in heart rate and pulse pressure associated with respiration (sinus arrhythmia)
Ps in I, II and aVF are always upright and always inverted in aVR Normal EKG Ps in V1 and V2 are Diphasic, but never negative in V2 Q Wave: Amplitude of Q waves usually < 4mm in all leads except in III where it may reach 5 mm and the depth is < 25% of the R wave in all leads except III. R wave: Measures about 15 mm in lead I, 10mm in aVL and can be about 19mm in II, III & aVF. S wave: Most prominent in aVR about 16mm, 9mm in III & aVL, and <5mm in I, III and aVF. ST : 1mm elevation may be seen especially in the inferior leads, but ST depression is pathologic in any lead as long as the axis is directed inferiorly and leftward. T wave: Always upright in I & II and inverted in aVR. Usually upright in aVF and inverted or upright in III & aVL. T wave is always upright in V5-6. Tallest in II,V2-3. <6mm in all limb leads., but not less than 0.5 mm in I & II QT interval: The duration of the ventricular electrical systole. Normal QTc is about 0.39 secs in males and 0.41 secs in females. QTc > 0.44 secs is ABNORMAL. U wave: Represent after potentials of ventricular myocardium. P waves duration varies between 0.08 – 0.11 secs with an amplitude of 0.25mV and P wave axis is directed Inferiorly and leftward (00 – 750) P waves are always upright in leads I and II, always inverted in aVR, diphasic in III, aVL, and V1, V2. A negative component of more than than one small square is considered abnormal. [left click once] PR Interval is measured form the beginning of the P wave to the beginning of the QRS with a normal duration of 0.12 – 0.20 seconds. Lead II is usually used to measure PR interval. Ventricular activation middle third of Left IV septum right septal surface RV leftward apex free walls of both ventricles basal portion of septum and the posterobasal portion of the free wall of LV are the last parts to be activated.
Normal axis -300 to 1200 AXIS Left axis deviation -300 to -900 Right axis deviation 1200 to 1800 Indeterminate (extreme) axis deviation -900 to 1800 AXIS
Differential Diagnosis Lead I Lead aVF Left axis deviation LVH, left anterior fasicular block, inferior wall MI Right axis deviation RVH, left posterior fascicular block, lateral wall MI Normal axis (-30 to +90degrees) Positive Positive Left axis deviation (-30 to -90) check lead II. To be true left axis deviation, it should also be down in lead II. If the QRS is upright in II, the axis is still normal (0 to -30). Positive Neg .Right axis deviation Neg Positive Indeterminate axis (-90 to -180) Neg Neg AXIS
LEFT AXIS DEVIATION If the axis is - 300 Biphasic in lead II, and negative in aVF If the axis is <300 predominantly negative in lead II and aVF
RIGHT AXIS DEVIATION Normal QRS width with an axis of >1000 Predominantly positive in leads II and III, and negative in aVL
Early Repolarization Note diffuse J-point elevation, early R wave transition, with notched downstroke of R wave in lateral precordial leads. These changes are characteristic of early repolarization as seen in this EKG of a 28 year old African-American male.
Normal variants or artifacts Normal variants or artifacts
ischemia Ischemia
General Introduction to ST, T, and U wave abnormalities The specificity of ST-T and U wave abnormalities is provided more by the clinical circumstances in which the ECG changes are found than by the particular changes themselves. Thus the term, nonspecific ST-T waveabnormalities, is frequently used when the clinical data are not available to correlate with the ECG findings. This does not mean that the ECG changes are unimportant! It is the responsibility of the clinician providing care for the patient to ascertain the importance of the ECG findings.
Factors affecting the ST-T and U wave configuration include: Intrinsic myocardial disease (e.g., myocarditis, ischemia, infarction, infiltrative or myopathic processes) Drugs (e.g., digoxin, quinidine, tricyclics, and many others) Electrolyte abnormalities of potassium, magnesium, calcium Neurogenic factors (e.g., stroke, hemorrhage, trauma, tumor, etc.) Metabolic factors (e.g., hypoglycemia, hyperventilation) Atrial repolarization (e.g., at fast heart rates the atrial T wave may pull down the beginning of the ST segment) Ventricular conduction abnormalities and rhythms originating in the ventricles
“Secondary” ST-T Wave changes • “Secondary" ST-T Wave changes (these are ST-T wave changes solely due to alterations in the sequence of ventricular activation) ST-T changes seen in bundle branch blocks (generally the ST-T polarity is opposite to the major or terminal deflection of the QRS) ST-T changes seen in fascicular block ST-T changes seen in nonspecific IVCD ST-T changes seen in WPW pre-excitation ST-T changes in PVCs, ventricular arrhythmias, and ventricular paced • beats
"Primary" ST-T Wave Abnormalities • "Primary" ST-T Wave Abnormalities (ST-T wave changes that are independent of changes in ventricular activation and that may be the result of global or segmental pathologic processes that affect ventricular repolarization) • Drug effects (e.g., digoxin, quinidine, etc) Electrolyte abnormalities (e.g., hypokalemia) Ischemia, infarction, inflammation, etc Neurogenic effects (e.g., subarachnoid hemorrhage causing long QT)
Causes of ST Elevation "ELEVATION" E - ElectrolytesL - LBBBE - Early RepolarizationV - Ventricular hypertrophyA - AneurysmT - Treatment - PericardiocentesisI - Injury (AMI, contusion)O - Osborne waves (hypothermia)N - Non-occlusive vasospasm
Differential Diagnosis of ST Segment Elevation Normal Variant “Early Repolarization” Ischemic Heart Disease Acute Pericarditis Other Causes
"Early Repolarization": • Normal Variant "Early Repolarization" (usually concave upwards, ending with large symmetrical,, upright T waves) • "Early Repolarization": note high take off of the ST segment in leads V4-6. • The ST elevation in V2-3 is generally seen in most normal ECG's. • The ST elevation in V2-6 is concave upwards, another characteristic of this normal variant.
Ischemic Heart Disease (usually convex upwards, or straightened) Acute transmural injury - as in this acute anterior MI • Persistent ST elevation after acute MI suggests ventricular aneurysm ST elevation may also be seen as a manifestation of Prinzmetal's (variant) angina (coronary artery spasm) ST elevation during exercise testing suggests extremely tight coronary artery stenosis or spasm (transmural ischemia)
Acute Pericarditis • Concave upwards ST elevation in most leads except aVR No reciprocal ST segment depression (except in aVR) Unlike "early repolarization", T waves are usually low amplitude, and heart rate is usually increased. May see PR segment depression, a manifestation of atrial injury • Other Causes: • Left ventricular hypertrophy (in right precordial leads with large S-waves) Left bundle branch block (in right precordial leads with large S-waves) Advanced hyperkalemia Hypothermia (prominent J-waves or Osborne waves)
J-point is the point where S wave becomes isoelectric and joins the T wave. ST segment elevation or depression is measured 2 small boxes away from the J-point and then, up or down the isoelectric line.
Differential Diagnosis of ST Segment Depression Normal variants or artifacts: • Pseudo-ST depression (wandering baseline due to poor skin- electrode contact) Physiologic J-junctional depression with sinus tachycardia (most likely due to atrial repolarization) Hyperventilation-induced ST segment depression • Ischemic heart disease • Nonischemic causes of ST depression
Non-ischemic causes of ST depression • RVH (right precordial leads) or LVH (left precordial leads, I, aVL) Digoxin effect on ECG Hypokalemia Mitral valve prolapse (some cases) CNS disease Secondary ST segment changes with IV conduction abnormalities (e.g., RBBB, LBBB, WPW, etc)
Ischemic heart disease Subendocardial ischemia (exercise induced or during angina attack “horizontal" ST depression in lead V6 Non Q-wave MI Reciprocal changes in acute Q-wave MI (e.g., ST depression in leads I & aVL with acute inferior MI)
Stages of Acute Q-Wave MI Ist Few Hours First 24 Hours First 72 Hours
Evolution of acute anterolateral myocardial infarction at 3 hours Tomb stoning is less prominent with the onset of T wave inversions in the anterior precordium. Reciprocal changes are resolving.
Evolution of acute anterolateral myocardial infarction at 24 hours Prominent Q waves have developed across the anterior precordium and leads I, aVL. However, ST segment elevation persists.
Evolution of acute anterolateral myocardial infarction at 72 Hours Q wave pattern in the anterolateral leads is well established. Persistent ST segment elevation suggests complication by aneurysm or pericarditis
Acute anteroseptal myocardial infarction a) ST elevation and tall T waves b) QS deflections in V1, V2 and V3 and V4
Right ventricular infarction (Rt.sided leads) ST segment elevation in leads V4R and V5R reveals right ventricular involvement complicating the inferior infarct.
ComplicatedAcute inferior myocardial infarction AV dissociation Note inferior ST segment elevation as well as atrioventricular dissociation secondary to complete heart block.
Acute inferior myocardial infarction complicated by Wenkebach wenckebach Note inferior ST segment elevation and Q waves as well as progressive prolongation of the PR interval followed by a dropped beat with grouped beating.
Tall R in V2,R/S >1 Inferoposterior MI • Q waves in leads II, III & aVF • Tall R wave in lead V2 with a duration of > 0.04 secs and R/S ratio equal to or >1 (in patients over 30 years of age without RVH)
Postero-lateral MI The "true" posterior MI is recognized by pathologic R waves in leads V1-2. These are the posterior equivalent of pathologic Q waves (seen from the perspective of the anterior leads). Tall T waves in these same leads are the posterior equivalent of inverted T waves in this fully evolved MI. The loss of forces in V6, I, aVL suggest a lateral wall extension of this MI.
Lateral myocardial infarction ST segment elevation in leads I and aVL associated with inferior reciprocal changes along with poor R wave progression. Note preexisting anteroseptal MI.
Subendocardial Ischemia Anterolateral ST segment depression is consistent with diffuse subendocardial ischemia vs. non-Q wave MI.
Unstable angina vs. non-Q wave myocardial infarction ST segment depression in leads V2 through V5 supports acute ischemic syndrome with no “Q” waves.
Non Q MI • Non-Q Wave MI • Recognized by evolving ST-T changes over time without the formation of pathologic Q waves (in a patient with typical chest pain symptoms and/or elevation in myocardial-specific enzymes) Although it is tempting to localize the non-Q MI by the particular leads showing ST-T changes, this is probably only valid for the ST segment elevation pattern • Evolving ST-T changes may include any of the following patterns: • Convex downward ST segment depression only (common) • Convex upwards or straight ST segment elevation only (uncommon) • Symmetrical T wave inversion only (common) • Combinations of above changes
Non-Q Wave MI • Convex downward ST segment depression only (common) • Convex upwards or straight ST segment elevation only (uncommon) • Symmetrical T wave inversion only (common)