Download
1 / 26
260 likes | 477 Vues
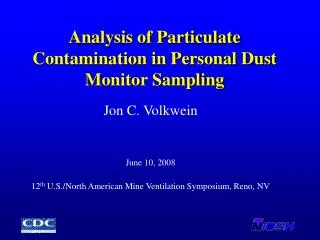
Advanced Sampling and Data Analysis for Source Attribution of Ambient Particulate Arsenic and Other Air Toxics Metals in St. Louis. Missouri Department of Natural Resources, Air Pollution Control Program and Environmental Services Program Washington University, St. Louis U. S. EPA.

E N D
Advanced Sampling and Data Analysis for Source Attribution of Ambient Particulate Arsenic and Other Air Toxics Metals in St. Louis Missouri Department of Natural Resources, Air Pollution Control Program and Environmental Services Program Washington University, St. Louis U. S. EPA
Introduction • The St. Louis Community Air Project (CAP) and the Blair St. National Air Toxics Trends Station (NATTS) have collected ambient air quality data that showed elevated concentrations of arsenic (among other hazardous air pollutants) were present in the ambient air in St. Louis. Accompanying these elevated ambient arsenic concentrations was an excess risk of cancer due to a lifetime inhalation exposure to ambient arsenic. • This Community-Scale Air Toxics Monitoring Project will attempt to identify and locate possible sources of arsenic emissions in the greater St. Louis area. • The first task of this project was to analyze quality-assured ambient arsenic data and an arsenic emissions inventory for the greater St. Louis area.
Summary of CAP and NATTS Monitoring Results • CAP: average arsenic concentration ~ MDL ~ 1/100,000 cancer benchmark = 0.002 ug/m3 • Blair St. and Arnold PM2.5 STN arsenic average about 0.002 ug/m3, Bonne Terre about 0.001 ug/m3 • NATTS: average arsenic concentrations ~ 0.002 to 0.001 ug/m3 at Blair St.; MDL ~ 0.00002 ug/m3 = 0.02 ng/m3
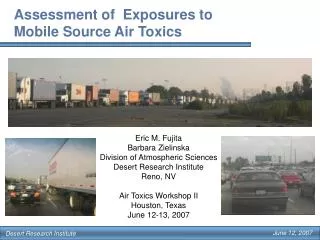
Excess Cancer Risk Characterization for Arsenic (PM10 and PM2.5) Based on Blair St. Ambient Monitoring Data
Arsenic Emission Inventory for the Greater St. Louis Area • Staff received the 2002 National Emissions Inventory (NEI) stack-level emissions data for sources of arsenic compounds (inorganic, including arsine) for the seven surrounding counties and St. Louis City from U.S. EPA Region 7 staff. Staff obtained the 1999 NEI from the 1999 National-Scale Air Toxics Assessment. • Staff queried the 1999 and 2002 NEI to identify and locate tentative sources of arsenic emissions in St. Louis City and, • Jefferson, St. Charles, and St. Louis Counties, MO • Madison, Monroe, Randolph, and St. Clair Counties, IL.
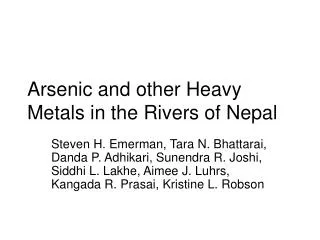
Quarterly Wind Directions, St. Louis 1st Quarter 01-05 2nd Quarter 01-05 3rd Quarter 01-05 4th Quarter 01-05
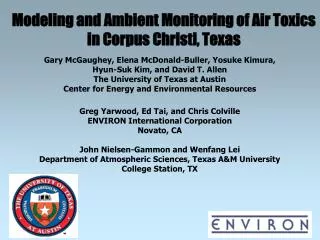
Conditional probability function (CPF) plots for PM2.5 arsenic at the St. Louis – Midwest Supersite and PM10 arsenic at the Blair St. NATTS site. CPF plots constructed using top 25% of 24-hour integrated arsenic and hourly-average winds measured at East St. Louis. STL-SS and Blair data for the periods 6/01-5/03 and 7/02-12/06, respectively.
Considerations • Ambient monitoring at the Blair St. NATTS reveal that the ambient PM10 and PM2.5 arsenic concentrations dropped in St. Louis City between 2004 and the first half of 2007. Future measurement and data analysis will determine whether this trend will continue for the long term. • Despite this downward trend, these ambient PM10 and PM2.5 arsenic concentrations are still associated with a cancer risk greater than 1− in −1,000,000 based on a 70-year exposure.
Considerations • According to the 1999 and 2002 NEIs, the majority of the point sources of arsenic compounds and associated facilities were located on the eastern side of the Mississippi River in the Illinois counties of Madison and St. Clair. • The largest amount of arsenic compounds released to the ambient air, however, occurred on the western side of the Mississippi River in the Missouri counties of Jefferson and St. Charles.
Project Goals • This community-scale air toxics monitoring project may help to identify the general area where sources of arsenic compounds are located, if not the sources themselves, the climatology involved, and other aspects of the ambient data. • This project may also provide information on whether the existing emission inventories are providing adequate information on the magnitude of these emissions. • The project will also provide results for other toxic metals, including lead, which may be of interest in determining whether urban concentrations are near levels of concern, and where source areas may be.
Project Plan • Phase I. Spatially and Temporally Enhanced 24-hour Integrated Measurements: 1-in-3 day PM10 sampling and metals analysis at 4 sites in the St. Louis area for 1 year (MDL~0.02-0.03 ng/m3, 24-hr samples) • Phase II. High Time Resolution Measurements: Time-resolved near-real-time analysis at six sites in the St. Louis area for 1 month at each site (MDL<0.1 ng/m3, possibly as low as 0.01 ng/m3, 4-hr samples) • Data Analysis and Reporting: source apportionment, source identification, model comparisons – MDNR and Washington University
Blair Street Hall Street
Washington University Arnold West
Cooper Environmental ServicesXact 620 Ambient Air Toxic Metals Monitor PM size-selective inlet Temperature controlled 19 inch rack Heater Sampling & Analysis Module Operator interface/control panel Flow control module This and the following slide provided by John Cooper, Cooper Environmental Services
Sample Flow X-Ray Tube Aerosol Deposit Chemistry Zone Analysis Area Filter Tape Filter Tape XACT SAMPLING AND ANALYSIS Previous sample is analyzed while current sample is collected
Phase I Analytes Potential Xact Analytes • Arsenic • Cadmium • Chromium • Lead • Manganese • Nickel Measured by XRF
Potential Phase II Locations • Blair Street • Arnold West? • Chain of Rocks?? • Illinois??? • Others?
(Phase I) (Phase II) ?