Download

1 / 25
410 likes | 1.44k Vues
Overall Equipment Effectiveness. OEE December 8th 2003. Overall Equipment Effectiveness.

E N D
Overall Equipment Effectiveness OEE December 8th 2003
Overall Equipment Effectiveness • Today modern plants have a number of systems in place to help them execute their production plans and schedules. These include Planning and Scheduling Systems, Inventory Management, Control Systems, Computer Aided Maintenance Systems, Logistic Systems ... and many more. In many organisations these systems are manual paper-based systems. Manually recording this data and calculating performances is an onerous, time consuming and costly process where usually more effort goes into collecting and processing the information as opposed to analysing the data, identifying the problems and finding the solutions.
Overall Equipment Effectiveness • Few automated systems provide a comprehensive view of production line or process efficiency that allows users analyse a plant’s true effectiveness to determine: • The rate of quality rejects (or why they occur) • Losses due to speed, short stops, speed imbalances on the line or setup times • Where in the line crucial bottlenecks are, and in which way they effect the line • What organizational problems exist • What other typical, repetitive negative impact occurrences exist and under what typical circumstances do they happen
Overall Equipment Effectiveness • As part of Total Productive Maintenance the Overall Equipment Effectiveness (OEE) metric has become the accepted way of measuring true plant performance. Recent studies show that the worldwide average OEE rate in manufacturing plants is 60%. This represents a poor return on manufacturing resources, plant/equipment investment.
Prime Causes of Production Losses • A production line seldom operates at optimum speed. A myriad of reasons or Negative Performance Impacts, mostly in combination, cause losses in productivity and therefore loss of money. These include: • Line Saturation • There is no place for more output from the machine. For example, a paper machine runs out of empty tambours. • Equipment Failure • Machines break down, wear out, are not used properly and so on. All ends up in lost production time. • Product changes • During the change over from one product to another the machine settings must be changed, breakdown may occur and speed must be reduced. • Short Stops • For example, a bottle falls down in a bottling machine and the operator picks it up. These short but frequent events can be the reason for major time loss.
Prime Causes of Production Losses • Operator Inefficiency • The operators like to have it nice and easy. They run with lower speed in order to guarantee smooth operation. • External reasons • Sometimes, the production runs out of orders and the machines have to shut down. Or there can be a failure in the electrical power network far away from the factory. • Product Type • Some products are more difficult to make. There are more breakdowns and quality problems. • Speed Losses • For one reason or another, the speed of the machine is not optimum. In order to save costs, someone has purchased cheap but poor quality raw material. • Quality • Although the machine is running, the products are not good enough for the customers. These are the most expensive kinds of losses. • Missing Material • The raw material storage is empty and machines can not produce any more.
Capturing Production Data • Efficiency improvement projects can only be successful if we really know which loss factors impact the most. This requires monitoring and measuring every second of production time, because even small losses can accumulate to be a major problem over time. Knowing the cause of a negative performance impact helps to effect positive improvement. Continuous monitoring can measure how successful improvement efforts are and leads to the next level of improvements. This is a continuous cycle. • Example • Line Speed Fluctuations may be noted by eye, but they are seldom measured accurately. As a result there is no notion of the importance of these accumulated losses. • With accurate measurement you may discover that speed losses actually add up to 11% of overall performance, 70% of which occur on a certain product type and that this happens mostly on one critical machine in the line.
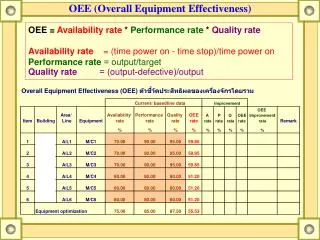
Overall Equipment Effectiveness • OEE is the key performance indicator for production lines and machines. It is an easy and understandable way to classify and calculate all the losses in production. • Availability factor (A) • Availability gives the actual running time in percentage. For example, if during one shift (8 hrs) a machine has been running for 6.5 hrs and it was standing still for 1.5 hrs because of repairs, then • A = 81.25% (= 6.5 hrs / 8 hrs) • Performance factor (P) • When the machine was running, the actual speed was below the nominal speed. Say, the optimal speed for the product is 12 units/min but machine was making only 10.5 units/min, then • P= 87.5% (=10.5/12) • Quality factor (Q) • When some of the products have been rejected, this is quality loss. Out of the 600 units produced in an hour, 35 were not according to the specification, then • Q = 94.17% (=(600-35)/600) • Planning factor (Pf) • There are scheduled shutdowns in every production line for several reasons. Machines need annual maintenance, teams allocated to other machines, or there are not enough orders. Say that the line is down for vacations 3 weeks in the summer, then • Pf = 94.1% (=(356 - 21) / 356)
Overall Equipment Effectiveness • OEE is a simple calculation: • OEE = A * P * Q • In our example: • OEE = 81.25% * 87.5% * 94.17% = 66.9% • Total Productivity: • Total Productivity can also be calculated: • Pr = OEE * PF • In our example: • Pr = 66.9% * 94.1% = 62.9%
Improving OEE • There are many ways to raise the OEE. Sometimes operators need more training, bottleneck machines require technical improvements, production schedules require fine tuning, products redesigned, operating instructions must be reviewed and so on. • Some of these improvements may require substantial investments. With good OEE measurement it is possible to select the project with quickest returns. • Accurate OEE measurement makes it possible to follow up the outcomes of the development projects and investments. The effect on the bottom line: • Cost reduction • Increased output • Extending line investments • Other benefits include: • Accurate production planning • Understanding the production process • Cooperation and team work
OPERA Real-time Information System • GPN Partners are specialist software developers and integrators of real-time information systems that automatically capture critical manufacturing process, production and environmental data. Data from these systems is used to improve production/process efficiency and decision making. • GPN Partners have developed the OPERA range of real-time information products which are profitably used in the following application areas: • Machine Downtime and Efficiency Monitoring • Plant Utilisation, Maintenance and Efficiency Calculation (OEE) • Process Monitoring and Control • Building Management and Environmental Monitoring • Energy Management and Control Systems • GPN use OPERA with their operational improvement skills to leverage business benefits
OPERA Real-time Information System • OPERA can be • interfaced to PLCs • Combined with data acquisition sensors to measure • Temperature • Pressure • Humidity • Flow • Speed • Voltages etc. • It can also be interfaced to packaging and filling machinery to count • Good parts • Bad parts • Downtime or rejects • Support for open standards such as OPC, allows OPERA connect to other software systems such as SCADA and ERP
OPERA GPN OEE • OPERA can provide you with all the relevant data required to make most of your production/process decisions in real-time. • Process calculators help interpret and transform raw machine signals in a way that is meaningful to the client • Existing systems can be automatically challenged with variances and alarms activated and forwarded to the operator and/or escalated to management by email, pager or SMS • Powerful data historians allow for centralisation of all data in an enterprise database and for detailed analysis of data by shift, batch, product, operator etc. • Flexible processors allow you to collect data to suit your own shift patterns. OPERA comes in a range of variants providing you with an upgrade path as your requirements expand. • GPN SME’s can teach & help you to understand this data and maximise the business benefit from this information.
OPERA GPN OEE • OPERA aids companies who are implementing Overall Equipment Effectiveness (OEE) programmes in their strive for World Class Manufacturing levels. • OPERA includes OEE calculation and report templates that can be customised to your requirements. • We also carry out OPERA OEE implementations, continuous improvement programmes and TPM training. GPN and our partners have broad experience in the pharmaceutical and other manufacturing sectors. We have helped companies utilising OEE software to achieve • 1% increase in OEE on average yields • 2% increase in capacity and can yield in excess of 4% • 1% reduction in unit cost • With over 80 cumulative years experience in the pharma and biopharma industries we have the expertise and application experience to provide a turnkey solution. • GPN software partners are ISO9001/TickIT certified and are Microsoft Gold Certified Partner demonstrating our commitment to best of breed technologies and quality processes.
OPERA GPN OEE The following slides contain some sample images of these OEE systems
The main data entry screen provides the focal pointfor capturing data Product Information can be captured from the site MRP/ERP system by keying in the schedule number (order number) All operational data on events that take place are captured automatically or manually dependent upon the requirements A notepad is included to provide detailed explanations downtime events. Records are created by shift and/or by new schedule Number (order number) Info@globalpharmanetworks.com
OEE calculations and the detail calculations are displayed on screen These can be viewed by individual record and by cumulative totals for a range of viewed records. Info@globalpharmanetworks.com
Analysis starts with top level downtime review for each individual record by equipment and by Downtime header. This screen also provides cumulative downtime by shop order by equipment and by category Info@globalpharmanetworks.com
Full drill down capability is a feature of the system Here downtime details are ‘Drilled’ into from the previous screen Each piece of equipment has a subset of downtime codes that can be viewed by individual record by cumulative downtime, by shop order or by equipment Info@globalpharmanetworks.com
Analysis of downtime events provides data to support root cause analysis and to support continuous improvement This allows the CI teams to focus on the areas of biggest benefit Info@globalpharmanetworks.com
An EIS (executive information Summary) provides an overview by workcentre or by plant Info@globalpharmanetworks.com
The system can display the key performance for each shift so that comparisons can be made across the 24 hour day. This allows root cause analysis to be performed and the key problem areas to be focused on As part of this the system provides graphic details of schedule performance Info@globalpharmanetworks.com
The system can provide analysis of the cumulative output for the workcentre and can compare this with the expected planned output to provide cumulative variance information. This information can be broken down by shift and provide details of the major problems causing downtime. In addition the system provides a graphic display of the output values for ease of use Info@globalpharmanetworks.com
Using this screen we can analyse the durations of changeovers. The data can be displayed by schedule number(order no) and the average, the shortest and the longest changeovers can be easily identified. It will also display the total number of changeovers in the period and analyse these by the changeover definition Info@globalpharmanetworks.com
For more information on OEE or our other services Email us at info@globalpharmanetworks.com Or visit our website www.globalpharmanetworks.com