Download
1 / 55
550 likes | 718 Vues
Lecture Eight Portfolio Management. Stand-alone risk Portfolio risk Risk & return: CAPM/SML. What is investment risk?. Investment risk pertains to the probability of earning less than the expected return. The greater the chance of low or negative returns, the riskier the investment.

E N D
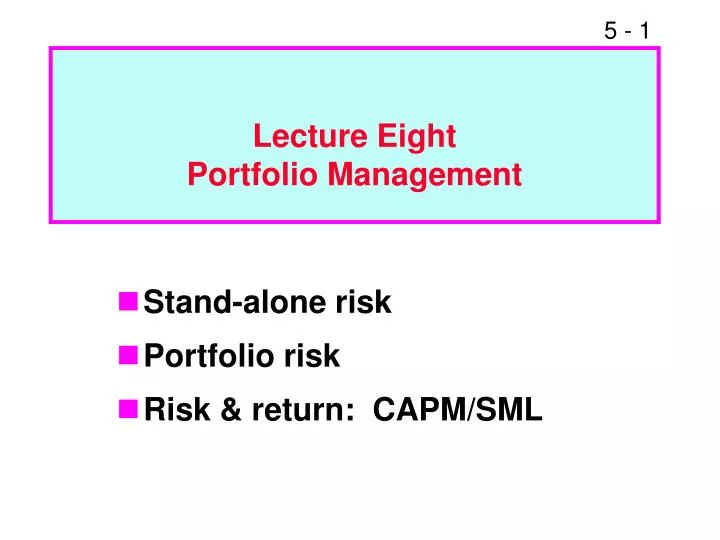
Lecture Eight Portfolio Management • Stand-alone risk • Portfolio risk • Risk & return: CAPM/SML
What is investment risk? Investment risk pertains to the probability of earning less than the expected return. The greater the chance of low or negative returns, the riskier the investment.
Probability distribution Firm X Firm Y Rate of return (%) -70 0 15 100 Expected Rate of Return
Economy Prob. T-Bill HT Coll USR MP Recession 0.1 8.0% -22.0% 28.0% 10.0% -13.0% Below avg. 0.2 8.0 -2.0 14.7 -10.0 1.0 Average 0.4 8.0 20.0 0.0 7.0 15.0 Above avg. 0.2 8.0 35.0 -10.0 45.0 29.0 Boom 0.1 8.0 50.0 -20.0 30.0 43.0 1.0 Investment Alternatives(Given in the problem)
Why is the T-bill return independent of the economy? Will return the promised 8% regardless of the economy.
Do T-bills promise a completelyrisk-free return? No, T-bills are still exposed to the risk of inflation. However, not much unexpected inflation is likely to occur over a relatively short period.
Do the returns of HT and Coll. move with or counter to the economy? • HT: With. Positive correlation. Typical. • Coll: Countercyclical. Negative correlation. Unusual.
Calculate the expected rate of return on each alternative: ^ k = expected rate of return. ^ kHT = (-22%)0.1 + (-2%)0.20 + (20%)0.40 + (35%)0.20 + (50%)0.1 = 17.4%.
^ k HT 17.4% Market 15.0 USR 13.8 T-bill 8.0 Coll. 1.7 HT appears to be the best, but is it really?
What’s the standard deviationof returns for each alternative? = Standard deviation. .
( ) ( ) 2 2 é ù 8.0 - 8.0 0 . 1 + 8.0 - 8.0 0 . 2 .5 ê ú ( ) ( ) 2 2 s = + 8.0 - 8.0 0 . 4 + 8.0 - 8.0 0 . 2 ê ú T - bills ê ú ( ) 2 + 8 . 0 - 8 . 0 0 . 1 ë û . sT-bills = 0.0%. sColl = 13.4%. sUSR = 18.8%. sM = 15.3%. sHT = 20.0%.
Prob. T-bill USR HT 0 8 13.8 17.4 Rate of Return (%)
Standard deviation (si) measures total, or stand-alone, risk. • The larger the si , the lower the probability that actual returns will be close to the expected return.
Expected Returns vs. Risk Expected Risk, s Security return HT 17.4% 20.0% Market 15.0 15.3 USR 13.8* 18.8* T-bills 8.0 0.0 Coll. 1.7* 13.4* *Seems misplaced.
Coefficient of Variation (CV) Standardized measure of dispersion about the expected value: Std dev s CV = = . ^ Mean k Shows risk per unit of return.
B A 0 sA = sB , but A is riskier because larger probability of losses. s = CVA > CVB. ^ k
Portfolio Risk and Return Assume a two-stock portfolio with $50,000 in HT and $50,000 in Collections. ^ Calculate kp and sp.
Portfolio Return, kp ^ ^ kp is a weighted average: n ^ ^ kp = Swikw. i = 1 ^ kp = 0.5(17.4%) + 0.5(1.7%) = 9.6%. ^ ^ ^ kp is between kHT and kCOLL.
Alternative Method Estimated Return Economy Prob. HT Coll. Port. Recession 0.10 -22.0% 28.0% 3.0% Below avg. 0.20 -2.0 14.7 6.4 Average 0.40 20.0 0.0 10.0 Above avg. 0.20 35.0 -10.0 12.5 Boom 0.10 50.0 -20.0 15.0 ^ kp = (3.0%)0.10 + (6.4%)0.20 + (10.0%)0.40 + (12.5%)0.20 + (15.0%)0.10 = 9.6%.
1 / 2 2 ( ) é ù 3.0 - 9.6 0 . 10 ê ú ê ú 2 ( ) + 6 . 4 - 9 . 6 0 . 20 ê ú ê ú 2 ( ) s = + 10 . 0 - 9 . 6 0 . 40 = 3.3%. ê ú p ê ú 2 ( ) + 12 . 5 - 9 . 6 0 . 20 ê ú ê ú ê ú 2 ( ) + 15 . 0 - 9 . 6 0 . 10 ë û 3.3% CVp = = 0.34. 9.6%
sp = 3.3% is much lower than that of either stock (20% and 13.4%). • sp = 3.3% is lower than average of HT and Coll = 16.7%. • \ Portfolio provides average k but lower risk. • Reason: negative correlation. ^
General statements about risk • Most stocks are positively correlated. rk,m» 0.65. • s » 35% for an average stock. • Combining stocks generally lowers risk.
Returns Distribution for Two Perfectly Negatively Correlated Stocks (r = -1.0) and for Portfolio WM Stock W Stock M Portfolio WM . . . . 25 25 25 . . . . . . . 15 15 15 0 0 0 . . . . -10 -10 -10
25 25 15 15 0 0 -10 -10 Returns Distributions for Two Perfectly Positively Correlated Stocks (r = +1.0) and for Portfolio MM’ Stock M’ Portfolio MM’ Stock M 25 15 0 -10
What would happen to theriskiness of an average 1-stockportfolio as more randomlyselected stocks were added? • sp would decrease because the added stocks would not be perfectly correlated but kp would remain relatively constant. ^
Prob. Large 2 1 0 15 Even with large N, sp» 20%
sp (%) Company Specific Risk 35 Stand-Alone Risk, sp 20 0 Market Risk 10 20 30 40 2,000+ # Stocks in Portfolio
As more stocks are added, each new stock has a smaller risk-reducing impact. • sp falls very slowly after about 40 stocks are included. The lower limit for sp is about 20% = sM .
Stand-alone Market Firm-specific = + risk risk risk Market risk is that part of a security’s stand-alone risk that cannot be eliminated by diversification. Firm-specific risk is that part of a security’s stand-alone risk which can be eliminated by proper diversification.
By forming portfolios, we can eliminate about half the riskiness of individual stocks (35% vs. 20%).
If you chose to hold a one-stock portfolio and thus are exposed to more risk than diversified investors, would you be compensated for all the risk you bear?
NO! • Stand-alone risk as measured by a stock’s sor CV is not important to a well-diversified investor. • Rational, risk averse investors are concerned with sp , which is based on market risk.
There can only be one price, hence market return, for a given security. Therefore, no compensation can be earned for the additional risk of a one-stock portfolio.
Beta measures a stock’s market risk. It shows a stock’s volatility relative to the market. • Beta shows how risky a stock is if the stock is held in a well-diversified portfolio.
How are betas calculated? • Run a regression of past returns on Stock i versus returns on the market. Returns = D/P + g. • The slope of the regression line is defined as the beta coefficient.
_ ki Illustration of beta calculation: Regression line: ki = -2.59 + 1.44 kM ^ ^ . 20 15 10 5 . Year kM ki 1 15% 18% 2 -5 -10 3 12 16 _ -5 0 5 10 15 20 kM -5 -10 .
Find beta • “By Eye.” Plot points, draw in regression line, set slope as b = Rise/Run. The “rise” is the difference in ki , the “run” is the difference in kM . For example, how much does ki increase or decrease when kM increases from 0% to 10%?
Calculator. Enter data points, and calculator does least squares regression: ki = a + bkM = -2.59 + 1.44kM. r = corr. coefficient = 0.997. • In the real world, we would use weekly or monthly returns, with at least a year of data, and would always use a computer or calculator.
If beta = 1.0, average stock. • If beta > 1.0, stock riskier than average. • If beta < 1.0, stock less risky than average. • Most stocks have betas in the range of 0.5 to 1.5.
Can a beta be negative? Answer: Yes, if ri,m is negative. Then in a “beta graph” the regression line will slope downward.
_ b = 1.29 ki HT 40 20 b = 0 T-Bills _ kM -20 0 20 40 -20 Coll. b = -0.86
Expected Risk Security Return (Beta) HT 17.4% 1.29 Market 15.0 1.00 USR 13.8 0.68 T-bills 8.0 0.00 Coll. 1.7 -0.86 Riskier securities have higher returns, so the rank order is OK.
Use the SML to calculate therequired returns. • Assume kRF = 8%. • Note that kM = kM is 15%. (Equil.) • RPM = kM - kRF = 15% - 8% = 7%. SML: ki = kRF + (kM - kRF)bi . ^
Required Rates of Return kHT = 8.0% + (15.0% - 8.0%)(1.29) = 8.0% + (7%)(1.29) = 8.0% + 9.0% = 17.0%. kM = 8.0% + (7%)(1.00) = 15.0%. kUSR = 8.0% + (7%)(0.68) = 12.8%. kT-bill = 8.0% + (7%)(0.00) = 8.0%. kColl = 8.0% + (7%)(-0.86) = 2.0%.
Expected vs. Required Returns ^ k k HT 17.4% 17.0% Undervalued: k > k Market 15.0 15.0 Fairly valued USR 13.8 12.8 Undervalued: k > k T-bills 8.0 8.0 Fairly valued Coll. 1.7 2.0 Overvalued: k < k ^ ^ ^
SML: ki = 8% + (15% - 8%) bi . ki (%) SML . HT . . kM = 15 kRF = 8 USR . T-bills . Coll. Risk, bi -1 0 1 2
Calculate beta for a portfolio with 50% HT and 50% Collections bp = Weighted average = 0.5(bHT) + 0.5(bColl) = 0.5(1.29) + 0.5(-0.86) = 0.22.
The required return on the HT/Coll. portfolio is: kp = Weighted average k = 0.5(17%) + 0.5(2%) = 9.5%. Or use SML: kp = kRF + (kM - kRF) bp = 8.0% + (15.0% - 8.0%)(0.22) = 8.0% + 7%(0.22) = 9.5%.
If investors raise inflationexpectations by 3%, whatwould happen to the SML?
Required Rate of Return k (%) D I = 3% New SML SML2 SML1 18 15 11 8 Original situation 0 0.5 1.0 1.5 2.0