Download
1 / 20
200 likes | 311 Vues
Transfers and Tariffs for Municipal Water Services. Water Research Commission Seminar on Tariffs, Costs, Revenue and Regulation. Presenters: Steven Kenyon and Kevin Venter | National Treasury | 14 June 2013. Presentation Outline.

E N D
Transfers and Tariffs for Municipal Water Services Water Research Commission Seminar on Tariffs, Costs, Revenue and Regulation Presenters: Steven Kenyon and Kevin Venter | National Treasury | 14 June 2013
Presentation Outline • General structure of the local government fiscal framework Transfers • Summary of transfers to fund water and sanitation in local government • Operational funding for water services • New local government equitable share formula Tariffs • Findings from National Treasury’s benchmarking engagements • Shortcomings in costing practices • Summary of National Treasury’s work to improve municipal costing
General principles for funding services in local government • The local government fiscal framework is made up of own revenues (including service charges) and transfers • Municipalities should charge cost-reflective tariffs for the supply of water for all users that can afford to pay • High levels of poverty mean that funds from national revenues are needed to fund the delivery of services to poor households Structure of the Local Government Fiscal Framework National Transfers 25% Local Government Own Revenue 75% Charges Rates and charges Employed HH in RDP house with improvements HH in informal settlement Poor HH in RDP house Middle to upper income HH
Summary of the transfers available for water and sanitation in 2013/14 Municipal Water Infrastructure Grant R603 million Water Services Operating Subsidy R560 million USDG R9 billion (mainly for providing serviced land - including water and sanitation) Rural Households Infrastructure Grant R107 million MIG R14.4 billion (over R7 billion for water and sanitation) Regional Bulk Infrastructure Grant R3.2 billion (indirect grant) R16.1 billion in operationsand maintenance funding for W&S in the Local Government Equitable Share Focus of this presentation is on operating funding (Not to scale)
The new LG equitable share formula structure A new LGES formula The local government equitable share was reviewed through a consultative process during 2012 and a new formula, based on 2011 Census data is being phased in over 5 years from 2013/14 Schematic of how the new formula works: Review was undertaken by: In partnership with:
Detail on the basic services component • Formula funds free basic services for every household below an affordability threshold of R2300 household income per month in 2011 • Based on value of 2 state Old Age Pensions (as proposed by municipalities) during the consultation process • 59% of all households in SA fall below this threshold • Cost of services and number of households will be updated annually • Cost of water updated based on average water board bulk tariff increases FBS funding allocated for each HH through the formula: Subsidy of R275.17 per month for a package of free basic services Includes 10% provision for maintenance
Summary of Local Government Equitable Share allocations for water • Total of R8.7 billion allocated for water through the LGES • This amount includes an allocation of R86.45 per household per month for free basic water (includes 10% allocation for maintenance) • Amount for water will be increased annually based on weighted average increase of water board prices (for bulk water costs) and inflation (for other costs)
Costing water and sanitation services for the LGES formula • During consultations, stakeholders wanted detailed costing in the formula that would account for local cost drivers (e.g. topographyand density) • This proved to not be technically feasible due to a lack of credible and agreed data on what factors drive costs (and by how much) and consistent measures of these cost drivers across all municipalities Advantages of using a single subsidy per poor household: • Municipalities can use any excess funding on one service to compensate for higher costs of another service • Recognises that municipalities have a responsibility to provide alternative services for households without connections • Recognises that the provision of alternative services is not necessarily any less expensive • Allows the formula to be updated based on an estimate of the growth in the number of households
LGES DELIVERY CHAIN: From formula to services The new formula and service delivery Formula divides LGES allocation among 278 municipalities (like slicing a R34bn cake) • Section 227 of the Constitution says: “Local government and each province is entitled to an equitable share of revenue raised nationally to enable it to provide basic services and perform the functions allocated to it.” • The equitable share is unconditional, but it is intended to fund the delivery of basic services • The new formula structure: • is more transparent about the funds available for basic services • Has more realistic cost estimates • Will have its data updated annually • Includes more realistic levels of institutional and community services funding • This will make it easier to hold municipalities accountable for how they budget for and use LGES funds Formula determines size of each ‘slice’ Municipalities determine how funds are used to deliver services to their residents
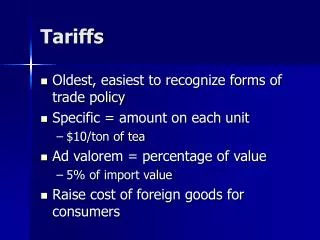
Findings of benchmarking engagements (1) • Basic accounting principles and costing methodologies are not applied to determine the ‘real’ cost of providing services • Tariff determination is not informed by accurate costing that incorporates direct, indirect and hidden costs of services • There is rarely a correlation between the annual tariffs in respect of basic services and the cost of providing such services • The traditional approach of incremental tariff increases is widely applied • The financial imbalance of the basic services is becoming increasingly greater with the costs exceeding the revenue generated by service charges
Findings of benchmarking engagements (2) • Decreased cash coverage and depleted cash backed reserves is a further concern • In general municipalities are becoming more and more grant dependent • Cost efficiency does not seem a widely applied practice • Inadequate allocations for asset renewal & maintenance
Findings of benchmarking engagements (3) • An analysis of the 17 non-delegated municipalities 2012/13 MTREF found that 8 municipalities budgeted for a cost reflective tariffs, others applied an incremental approach
Findings of benchmarking engagements (4) • These deficits reflected on the table above mean that municipalities are: • Cross subsidising tariff services with property rates • Depleting the limited reserves available • Budgeting for deficits or adopting the mythical “balanced budget approach” • This is detrimental to financial sustainability and consequently places service delivery at risk
Shortcomings in costing practices • Engagements were held with the various financial system vendors in order to establish if their systems catered for internal cost recoveries (cost accounting). • It must be noted that only 40 % of municipalities do apply some sort of cost allocation, but the manner in which they allocate direct and indirect costs is weak • Where municipalities are attempting to cost for services, there calculations are usually limited to direct costs such as remuneration and bulk purchases, with little or no consideration for indirect costs • The traditional approach of incremental tariff increases is widely applied • The financial imbalance of basic services is becoming increasingly greater with costs exceeding the revenue generated by service charges.
Progress to date • Pilot study at uMhlathuze on costing; • Compilation of costing guidelines; • Accompanied DWA on their road shows; • Assisted various municipalities with costing and tariff setting; • Various training sessions to CFO forums & Provincial Treasuries; and • Inclusion of an additional segment (Management Accounting) in SCOA
Conclusion • Costs, cost management and a costing methodology should not be informed by a specific approach i.e. ABC, absorption costing etc., but should rather be a hybrid solution aimed at the specific requirement of LG in a South African context. • The time, effort and cost should always be justified by the outcome. • Municipalities that work to a longer planning horizon and understand the impact of cost drivers and cost management will be in a position to: • Test the likely impact of different income scenarios; • Seek out alternative models for sharing local resources more effectively; • Increase the impact of spending and influence; • Challenge the status quo of the design, management and delivery of services; • Improve efficiency by streamlining business processes;’ • Be in a position to decide on trade-offs in meeting the current challenges and preserving capacity for the longer term; and • And start understanding the costs of specific service delivery i.e. agency services, underfunded mandates etc