Download
1 / 18
180 likes | 594 Vues
Asthma Prevalence in the United States. June 2014. National Center for Environmental Health. Division of Environmental Hazards and Health Effects.

E N D
Asthma Prevalence in the United States June 2014 National Center for Environmental Health Division of Environmental Hazards and Health Effects
CDC’s National Asthma Control Program (NACP) was created in 1999 to help the millions of people with asthma in the United States gain control over their disease. The NACP conducts national asthma surveillance and funds states to help improve asthma surveillance and to focus efforts and resources where needed.
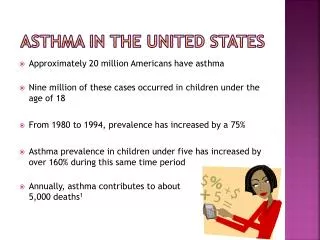
Introduction Asthma: • is a chronic disease of the lungs • affects adults and children of all ages • is characterized by repeated episodes of wheezing, breathlessness, chest tightness, and nighttime or early morning coughing
Introduction • In most cases, we don’t know the exact causes of asthma and we don’t know how to cure it • Most people with asthma can control their symptoms by: • avoiding things that trigger an asthma attack and • receiving appropriate medical care • Without proper management, asthma can result in frequent emergency department (ED) visits, hospitalizations, and premature deaths.
Introduction Asthma: • affects 25.7 million people, including 7.0 million children under 18; • is a significant health and economic burden to patients, their families, and society: • In 2010, 1.8 million people visited an ED for asthma-related care and 439,000 people were hospitalized because of asthma
Introduction Asthma prevalence is an estimate of the percentage of the U.S. population with asthma. Prevalence estimates help us understand the burden of asthma on the nation. • Asthma “period prevalence” is the percentage of the U.S. population that had asthma in the previous 12 months. • “Current” asthma prevalence is the percentage of the U.S. population who had been diagnosed with asthma and had asthma at the time of the survey. • Asthma “period prevalence” was the original prevalence measure (1980-1996). The survey was redesigned in 1997 and this measure was replaced by lifetime prevalence (not presented in slides) and asthma episode or attack in the past 12 months. In 2001, another measure was added to assess current asthma prevalence.
Asthma Period Prevalence and Current Asthma Prevalence: United States, 1980-2010 Current asthma prevalence, 2001-2010 Asthma period prevalence, 1980-1996 The percentage of the U.S. population with asthma increased from 3.1% in 1980 to 5.5% in 1996 and 7.3% in 2001 to 8.4% in 2010.
Current Asthma Prevalence: United States, 2001-2010 Percent Total number of persons Year One in 12 people (about 26 million, or 8% of the U.S. population) had asthma in 2010, compared with 1 in 14 (about 20 million, or 7%) in 2001.
Current Asthma Prevalence by Race and Ethnicity:United States, 2001-2010 Blacks are more likely to have asthma than both Whites and Hispanics.
Current Asthma Prevalence by Age Group, Sex, Race and Ethnicity, Poverty Status, Geographic Region, and Urbanicity: United States, Average Annual 2008-2010 Children, females, Blacks, and Puerto Ricans are more likely to have asthma. People with lower annual household income were more likely to have asthma. Residents of the Northeast and Midwest were more likely to have asthma. Living in or not in a city did not affect the chances of having asthma.
Child and Adult Current Asthma Prevalence by Age and Sex: United States, 2006-2010 Among children aged 0-14, boys were more likely than girls to have asthma. Boys and girls aged 15-17 years had asthma at the same rate.. Among adults women were more likely than men to have asthma.
Asthma Attack Prevalence among Children and Adults with Current Asthma: United States, 2001-2010 Children aged 0-17 years Adults aged 18 and over From 2001 to 2010 both children and adults had fewer asthma attacks. For children, asthma attacks declined from at least one asthma attack in the previous 12 months for 61.7% of children with asthma in 2001 to 58.3% in 2010. For adults, asthma attacks declined from at least one asthma attack in the previous 12 months for 53.8% of adults with asthma in 2001, to 49.1% in 2010.
Asthma Attack Prevalence among Persons with Current Asthma by Age Group, Sex, Race and Ethnicity, Poverty Status, and Geographic Region: Unites States, Average Annual 2008-2010 From 2008 to 2010 asthma attacks occurred more often in children and women, among families whose income was below 100% of the federal poverty threshold, and in the South and West. Race or ethnicity did not significantly affect asthma attack prevalence.
Adult Self-Reported Current Asthma Prevalence (%) by State or Territory, 2010 ME WA ID MT MN VT ND OR NY NH WI MI SD MA WY RI PA CA CT IA NV NJ OH IL NE UT IN DE WV CO MD VA MO DC KS KY NC TN AZ NM OK TX AR SC GA AL MS LA FL AK HI PR 6.0 – 7.7 7.8 – 8.5 8.6 – 9.3 9.4 – 9.9 10.0 – 11.1
Technical Notes Asthma Period Prevalence and Current Asthma Prevalence: Estimates of asthma prevalence indicate the percentage of the population with asthma at a given point in time and represent the burden on the U.S. population. Asthma prevalence data are self-reported by respondents to the National Health Interview Survey (NHIS). Asthma period prevalence was the original measure (1980-1996) of U.S. asthma prevalence and estimated the percentage of the population that had asthma in the previous 12 months. From 1997-2000, a redesign of the NHIS questions resulted in a break in the trend data as the new questions were not fully comparable to the previous questions. Beginning in 2001, current asthma prevalence (measured by the question, ‘‘Do you still have asthma?’’ for those with an asthma diagnosis) was introduced to identify all persons with asthma. Current asthma prevalence estimates from 2001 onward are point prevalence (previous 12 months) estimates and therefore are not directly comparable with asthma period prevalence estimates from 1980 to 1996 Behavioral Risk Factor Surveillance System (BRFSS): State asthma prevalence rates on the map come from the BRFSS. The BRFSS is a state-based, random-digit-dialed telephone survey of the noninstitutionalized civilian population 18 years of age and older. It monitors the prevalence of the major behavioral risks among adults associated with premature illness and death. Information from the survey is used to improve the health of the American people.More information about BRFSS can be found at: http://www.cdc.gov/brfss/.
Sources CDC National Center for Health Statistics, National Health Interview Survey (NHIS) National Surveillance of Asthma: United States, 2001-2010 • Asthma Period Prevalence and Current Asthma Prevalence: United States, 1980-2010. Adapted from Figure 26 in National Surveillance of Asthma: United States, 2001-2010. • For comparison among population subgroups, percentages were adjusted by age using the 2000 U.S. Census standard population. • Current Asthma Prevalence: United States, 2001-2010. See Figure 1 in National Surveillance of Asthma: United States, 2001-2010. • For comparison among population subgroups, percentages were adjusted by age using the 2000 U.S. Census standard population. See Table 1 for underlying data. • Current Asthma Prevalence by Race and Ethnicity: United States, 2001-2010. See Table 1 for underlying data in National Surveillance of Asthma: United States, 2001-2010. • For comparison among population subgroups, percentages were adjusted by age using the 2000 U.S. Census standard population. • Race categories ‘White’ and ‘Black’ include only those with a single race. Persons of Hispanic origin may be of any race. • Current Asthma Prevalence by Age Group, Sex, Race and Ethnicity, Poverty Status, Geographic Region, and Urbanicity: United States, Average Annual 2008-2010. See Figure 2 in National Surveillance of Asthma: United States, 2001-2010. • represents 95% confidence interval. • Crude (unadjusted) percentages are presented. See Table 2 for underlying data. • The categories ‘Puerto Rican’ and ‘Mexican’ are subcategories of Hispanic.
Sources (continued) CDC National Center for Health Statistics, National Health Interview Survey (NHIS) • Child and Adult Asthma Prevalence by Age and Sex: United States, 2006-2010. • Crude (unadjusted) percentages are presented. • Asthma Attack Prevalence among Children and Adults with Current Asthma (Risk-based): United States, 2001-2010. See Figure 5 in National Surveillance of Asthma: United States, 2001-2010. • Crude (unadjusted) percentages are presented. See Table 5 for underlying data. • Asthma Attack Prevalence among Persons with Current Asthma (Risk-based) by Age Group, Sex, Race and Ethnicity, Poverty Status, and Geographic Region: Unites States, Average Annual 2008-2010. See Figure 6 in National Surveillance of Asthma: United States, 2001-2010. • represents 95% confidence interval. • Crude (unadjusted) percentages are presented. See Table 6 for underlying data • The categories ‘Puerto Rican’ and ‘Mexican’ are subcategories of ‘Hispanic’. CDC Behavioral Risk Factor Surveillance System (BRFSS) • Adult Current Asthma Prevalence by State or US Territory, 2010. See Table C1 for underlying data in 2010 Adult Asthma Data: Prevalence Tables and Maps.
For more information please contact Centers for Disease Control and Prevention 1600 Clifton Road NE, Atlanta, GA 30333 Telephone: 1-800-CDC-INFO (232-4636)/TTY: 1-888-232-6348 Visit: www.cdc.gov | Contact CDC at: 1-800-CDC-INFO or www.cdc.gov/info The findings and conclusions in this report are those of the authors and do not necessarily represent the official position of the Centers for Disease Control and Prevention. National Center for Environmental Health Division of Environmental Hazards and Health Effects