Download
1 / 148
1.48k likes | 1.76k Vues
MnRAM 3.3 Database Training Visual Guidance Database information Download MnRAM software Get started entering data Various reports Using MnRAM Field/office procedures Step by step through all the questions Contents of this slideshow Disclaimer

E N D
MnRAM 3.3 Database Training Visual Guidance
Database information Download MnRAM software Get started entering data Various reports Using MnRAM Field/office procedures Step by step through all the questions Contents of this slideshow
Disclaimer • 3.3 is in beta release—not yet fully tested (although much improved over 3.2). • Your comments are welcome. • If you don’t see a soil type, watershed, or other item you expect in a drop-down list, contact us. • MnRAM is being improved all the time. Planning for Version 4.0 has already begun.
Downloading MnRAM 3.3 www.bwsr.state.mn.us/wetlands/mnram/index.html
Plan ahead to ensure quality data. Comprehensive Guidance covers: Procedures for an actual inventory. Map notation, GIS labeling, managing incoming field data, etc. Data Collection Procedures
Collect background documentation: Site survey, hydrology, topography, aerial photos, soils data Review other project information Enter all Wetland IDs Answer certain marked questions: Database red highlighted Excel fieldsheet italicized Text version “~” in left margin Data Collection Procedures, cont. Before you go outside…
Start on the General Information tab. Project name and Watershed. Other location data is optional. Size of existing and original size of wetland (anything = zero, enter “0.0001”). Record special notes and purpose of assessment. (See next slide for screen view and animated highlights) Entering Data: Getting Started
Formula calculations require area data. If the current size is zero, enter 0.0001. Entering area data
Next set of slides for manual and digital users. Some data recording differs in manual versus database version, esp. in vegetation portion. General order of slides will be: Text of question Guidance for that question Visual guide to special issues Using MnRAM
Check all that apply. Use scroll bar to see lower portion of page: Special Features tab Some special features “bump” a wetland into an Exceptional rating. Others are for record-keeping.
Is the wetland part of, or directly adjacent to, an area of special natural resource interest? Check those that apply: a. ____ Designated trout streams or trout lakes (see MnDNR Commissioners Order 2450 Part 6262.0400 subparts 3 and 5) (If yes, Fishery Habitat Rating is Exceptional). b. ____ Calcareous fen (Special Status see MN Rule Chapter 7050) (If yes, Vegetative Diversity/Integrity functional rating is Exceptional) Consult MN DNR for regulatory purposes. c. ____ Designated scientific and natural area (If yes, then Aesthetics/Recreation/Education/Cultural functional rating is Exceptional). d. ____ Rare natural community (refer to MnDNR County Biological Survey/Natural Heritage)(If yes, Vegetative Diversity/Integrity is Exceptional, also if question 36 is yes and Wildlife Habitat functional rating is Exceptional); e. ____ High priority wetland, environmentally sensitive area or environmental corridor identified in a local water management plan, f. ____ Public park, forest, trail or recreation area. Special Features in detail, a-f
Equipment: Laptop/tablet Field sheets GPS References Site, topo map aerials In the field
Up to five communities may be listed. Each community’s contribution to the whole wetland is counted as a percentage of 100%. Communities less than 10% are not counted*. #1: Identify Plant Communities *With one exception (see next slide)
Key out plant communities: Floodplain forest, 3B Sedge meadow, 13A Shrub-carr, 8B Shallow, open water, 16A Shallow marsh, 13B Wondering what happened to #2? It comes up later…. 2 #1: Identify Plant Communities #3: Rate Plant Communities Rate quality of each community: – High – High • [10% rule exception for shallow, open water: any fringe emergent community] – High Unsure after seeing the ratings? Reconsider your classification. – High – High 1 4 5 3
# 1 Identify communities. Fill in Cowardin and Circular 39 ratings for each community. #3 Rate each community for quality. #1: Identify#3: Rate ~ Plant Communities ~ #2 is a separate table...
Click here for a drop-down Cover Category list… #2: Dominant Species/Cover class Identify the dominant species that make up at least 10% coverage…
Look up species by common/group name or by scientific name. Click the Display Name Toggle to alternate. Don’t try to list every plant. #2: Dominant Species drop-down list • Use the <3% cover class only for rare or invasive species.
Field Worksheet: Side 1 • On the Excel worksheet, each community has its own section. • You enter cover class and invasives, as well as community quality.
#2: Dominant species • Text version: list by community • Each community has a space for the dominants or invasive plants • Digital version: one list for entire site • No breakdown by community • List the dominant plants from the entire site • Whether text or database, this list is for record-keeping only: species entries do not affect ratings
For help distinguishing among native, invasive, and hybrid cattail, click on the Key (for a written description) or Table (summary version). (click for image) #2: Cattail Key/Table
4. Y N Are state or federally listed rare plant species or species found or known to be found recently? If Special Features questions d or i [rare natural community and rare plant species] are answered yes, then this question is yes and Vegetative Diversity function is Exceptional. 5. Y N Is the wetland plant community scarce or rare within the watershed, imperiled (S2), or critically imperiled (S1).? Yes if Special Features question b is answered yes. If the wetland community identified in Question #1 is 3A (not dominated by silver maple), 4A, 4B, 7A, 7B, 10A, 13A, 13B (mixed emergent marsh not dominated by cattails), 14A, 15A, AND has a High quality rating from Question #2, then this question is yes and Vegetation function is Exceptional; otherwise continue with following questions. #4-5: Rare or endangered vegetation
Guidance: The Mn DNR Natural Heritage Program collects, manages, and interprets information about nongame animals, native plants, and plant communities to promote the wise stewardship of these resources. The Natural Heritage Program has developed a ranking system that is intended to reflect the extent and condition of natural communities and species in Minnesota. These ‘state ranks’ have no legal ramifications, they are used by the Natural Heritage Program to set priorities for research and for conservation planning. They are grouped as follows: State Element Rank: S1: Critically imperiled in the state because of extreme rarity. S2: Imperiled in state because of rarity. S3: Rare or uncommon in state. S4: Apparently secure in state. S5: Demonstrably secure in state. #5 Guidance, rare community
Y N Does the wetland represent pre-European-settlement conditions? (e.g. MnDNR Native Plant Communities publication) If yes, then Vegetation function is Exceptional (continue to answer subsequent questions). Created wetlands would not qualify, regardless of quality. #6: Pre-European-settlement Condition
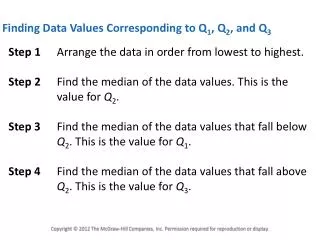
There are four ways to report this function: Individual Community Scores: maintain raw data as recorded. Highest Quality Community: report the highest-functioning community. Non-Weighted Average Quality of all Communities: straight average Weighted Average Quality Based on Percentage of Each Community: multiply each community rating by its percentage, then add all together. Formula: Vegetative Integrity/Diversity
Four columns per sheet One wetland per column or Same wetland, different assumptions (one as-is, another as expected, etc.) Watch ratings! You might circle High when the answer you want give is called “Low” on the worksheet. (click to see the sheet) Field Worksheet: Side 2
The italicized questions require maps or other data to be answered. Every other question is formatted as bold just to make it easier to read. If the question asks for a percentage of H-M-L, put the percentage of each under the correct heading: Field Worksheet: useful tips H M L 20% 60% 20%
Describe the hydrogeomorphology of the wetland and associated topography (check those that apply): ___ Depressional/Isolated (no discernable outlets) ___ Depressional/Flow-through (apparent inlet and outlet) ___ Depressional/Tributary (outlet but no perennial inlet or drainage entering from upstream subwatershed) ___ Riverine (within the river/stream banks) ___ Lacustrine Fringe (edge of deepwater areas)/Shoreland ___ Extensive Peatland/Organic Flat ___ Slope ___ Floodplain (outside waterbody banks) ___ Other ________________________ #7: Topographic data Stormwater pond
8. Approximate maximum depth of standing water in the wetland (inches): ______ Percent of wetland area inundated: ______% 9. What is the estimated area of the wetland's immediate drainage area in acres?_____ 10. Wetland size. This information should have been entered on the General Information page. The number remains as a placeholder. #8-10: Site data
Survey Classification(s): Adjacent upland (within 500 feet) Wetland area click for image of soil data website #11: Soils data
The text in the following slides has been edited to fit. Starting with #12, questions are answered (generally) by filling in A-B-C. Each question has guidance to assist the user in interpreting the question and understanding how to answer in difficult site conditions… MnRAM Rating Questions
For help with individual questions, click the “?”… Guidance, how to …then use the scroll bar to read the text:
Explains the intent of the question. Suggests examples of how to answer given certain conditions. Points out common errors or misconceptions about that particular question. Guidance, purpose of
For depressional wetlands, describe the wetland surface and subsurface outlet characteristics as it relates to the wetland’s ability to detain runoff and/or store floodwater. High = No surface or subsurface outlet, or a restricted outlet at or greater than 2 feet higher than the wetland boundary Medium = Swale, channel, weir, or other large, surface outlet (>18 inch pipe) with outflow elevation 0-2 feet above the wetland boundary, subsurface tile with no surface inlet. Low = Wetland outflow elevation below the wetland boundary with either a high capacity surface outlet (swale, channel, weir, pipe >18 inch diameter, etc…) or a subsurface outlet (drain tile) with a surface inlet. N/A = Not applicable for floodplain, slope, lacustrine, riverine, and extensive peatland/flat wetlands. #12: Outlet/Flood retention
Describe the wetland surface and subsurface outlet characteristics as it relates to the wetland hydrologic regime: High = No outlet ,natural outlet condition, or a constructed outlet at the historic outflow elevation; no evidence of subsurface drainage (drain tile). Medium = Constructed, reduced capacity outlet below the top of the temporary wet meadow zone; moderate indications of subsurface drainage; outlet raised above the wet meadow zone if managed to mimic natural conditions; watercourse has been recently ditched/channelized. Low = Excavated or enlarged outlet constructed below the bottom of the wet meadow zone; strong indications of subsurface drainage; outlet removes most/all long-term and temporary storage; or outlet changes hydrologic regime drastically. #13: Outlet/hydrologic regime
The ability of a wetland to maintain a hydrologic regime characteristic of the wetland type is somewhat dependent upon whether a natural outlet is present, or whether an outlet has been constructed or modified by humans. Constructed outlets can significantly diminish the ability of a wetland to provide temporary and long-term water retention, and thus its ability to maintain its characteristic hydrologic regime. Wetlands with natural outlets are functioning at the highest level possible for the type within the wetland comparison domain, and should be rated high. Constructed outlets above the temporary wetland (wet meadow) zone are rated medium if managed to mimic natural conditions. Constructed outlets, either surface or subsurface, below the top of the temporary wet meadow zone reduce the ability of the wetland to provide temporary and long-term water retention; if a constructed outlet is present below the top of the temporary wetland zone, but is such that the wetland is able to provide some temporary and long-term water retention (i.e. the wetland is only partially drained), the rating should be medium. Constructed outlets, either surface or subsurface, which remove most or all temporary and long-term retention capabilities, significantly reduce the ability of the wetland to maintain its characteristic hydrologic regime; the rating should be low. Constructed outlets that keep open water wetlands open water or keep saturated wetlands saturated are rated medium. #12&13 Guidance: outlet characteristics If the constructed outlet changes the wetland to non-wetland or to deepwater habitat or from saturated conditions to open water or from open water to saturated then it is rated low.
#12: Outlet for Flood How well can this wetland keep water in? (The more, the better.)
H – only for natural outlet conditions M – constructed outlets, no hydro. change L – changed hydrology (higher or lower) #13: Outlet for hydrologic regime How natural is this wetland’s outlet? (Less human intervention = better.)
Describe the dominant land use and condition of the immediate upland drainage area of wetland or within 500 feet of the wetland if the subwatershed area is not known: High = Watershed conditions essentially unaltered; < 10% impervious (i.e. low density residential, >1 acre lots); land use development minimal, idle lands, lands in hay or forests or low intensity grazing. Medium = Watershed conditions somewhat modified; e.g., 10–30 % impervious (i.e. medium density residential, 1/3 to 1 acre lots); moderate intensity grazing or haying with some bare ground; conventional till with residue management on moderate slopes, no-till on steep slopes. Low = Watershed conditions highly modified; e.g., >30 % impervious surfaces (i.e. high density residential, lots smaller than 1/3 acre, industrial, commercial, high impervious institutional) maximizing overland flow to the wetland; intensive agriculture or grazing with a high amount of bare ground, no residue management on moderate or steep slopes, intensive mining activities. # 14: Upland conditions
Overland flow affects wetland flood storage capabilities and overland flow is affected by changes in upstream vegetative communities.Upland land use within the watershed contributing to the wetland (as defined in Question #9) and the watershed size have a significant influence on the flow of runoff and sediments to the wetland, and thus the ability of the wetland to desynchronize flood flows and maintain its characteristic hydrologic regime. The more developed and intensively the watershed is used, the greater the delivery of runoff and sediments to the wetland is likely to be and the more likely the wetland will have the opportunity to minimize flooding downstream. With increased runoff and sediment delivery, the wetland will be less likely to maintain its characteristic hydrologic regime. As the proportion of the impervious watershed area increases, runoff volume and rate increases along with sediment concentrations. #14 Guidance, dominant upland land use
H = unaltered M = 10-30% impervious L = >30% impervious #14: Immediate upland land use
Describe the conditions of the wetland soils: High = There are no signs or only minor evidence of recent disturbance or alteration to the wetland soils; temporary wetland wet meadow zone intact; idle land, hayed or lightly to moderately grazed or logged. Minimal compaction, rutting, trampling, or excavation damage to wetland. Medium = Moderate evidence of disturbance or alteration to the wetland soils. Temporary wet meadow zone tilled or heavily grazed most years. Zones wetter than temporary receive tillage occasionally. Some compaction, rutting, trampling, or excavation in wetland is evident. Low = Evidence of significant disturbance or alteration to the wetland soils. Wetland receives conventional tillage most (>75%) years; or otherwise significantly impacted (e.g., fill, sediment deposits, cleared, excavated). Severe compaction, rutting, trampling, or excavation damage to wetland. #15: Wetland soil condition
The condition of the soils in the wetland affects the vegetation within the wetland, and thus the relationships affecting ground-water discharge, recharge, and evapotranspiration. The more intensively the wetland is used (i.e. tillage, excavation, vehicle traffic, pedestrian or livestock usage), the more likely these relationships are to be impacted, and the more likely the ability of the wetland to maintain its characteristic hydrologic regime will be reduced. #15 Guidance, Wetland soil conditions
For flow-through wetlands, enter the proportion of the wetland that is vegetated with emergent, submergent, or floating-leaved vegetation. ______% (High = Dense vegetative cover >75%, or isolated wetlands with outlet above wetland boundary; Medium = Combination of some unvegetated open water and vegetative cover 25 - 75%; Low = Primarily unvegetated open water or vegetative cover <25%; or N/A = Not applicable, if wetland is isolated enter 0. #16: Wetland vegetation
Wetland Vegetation is assessed here for two related properties: Water/Vegetation Proportions and Interspersion. Rooted vegetation in flow-through wetlands slows floodwaters by creating frictional drag in proportion to stem density, more or less according to vegetation cover type and interspersion. Flow-through wetlands with relatively low proportions of open water to rooted vegetation and low interspersion of water and rooted vegetation are more capable of altering flood flows. Dense stands of rooted vegetation, including trees, shrubs, and herbaceous emergent are more capable of slowing floodwater than open water alone. (click for next) #16 Guidance, wetland vegetation 2) Nutrient Uptake/Cycling. Ability to uptake, metabolize, sequester and/or remove nutrients and imported elements from the water is primarily dependent on wetland vegetative conditions. Microbial processing and bioaccumulation are associated with plant cover.Vegetative density can serve as an index of primary production, which is an indicator of nutrient assimilation. Wetlands take up metals both by adsorption in the soils and by plant uptake via the roots. They allow metabolism of oxygen-demanding materials and can reduce fecal coliform populations. Pollutants are often buried by deposition of newer plant material, isolating them in the sediments.
For flow-through wetlands, describe the roughness coefficient of the potential surface floodwater flowpath in relation to wetland vegetation biomass, numeric density and plant morphology: High = Dense bushy willow, heavy stand of timber with downed trees, or mature field crops with flow at half or less of crop height Medium = Dense grass with rigid stems, weeds, tree seedlings, or brushy vegetation where flows can be 2-3 times the height of the vegetation. Low = Primarily flexible turf grass or other supple vegetative cover or unvegetated N/A = Not applicable if wetland is isolated. #17: Detention of floodwater
Forest cover and other woody stems increase surface roughness resulting in an increased detention of high flows. The cumulative effect is reduced peak flows downstream. A forest (i.e. ash, boxelder, red maple, conifers) with a dense understory is best for detaining high flows. Without a forest present, woody shrubs (i.e. alder, willow, red osier dogwood) can be extremely effective but lose effectiveness once high flows approach and exceed the woody shrub height. Dense, non-woody vegetation (i.e. cattails, reed canarygrass) are effective at detaining minor flood flows but lay down to higher flows and the surface roughness greatly diminishes. Turf grass and other supple vegetation has minimal effects on flood flows. Open water wetlands with submergent and scattered emergent vegetation are part of the channel characteristics and have minimal effect on detaining flood flows. The Manning’s roughness coefficient decreases as water depth increases above the macorphytes and other surface roughness characteristics. Dense, robust, tall vegetation is best for floodplains. #17 Guidance, floodwater detention of F-T wetlands
Describe the extent of observable/historical sediment delivery to the wetland from anthropogenic sources including agriculture: High = No evidence of sediment delivery to wetland. Med. = Minor evidence of accelerated sediment delivery in the form of stabilized deltas, sediment fans Low = Major sediment delivery evidenced by buried detritus and/or vegetation along outer edge of temporary wetland (wet meadow) zone. Recent deltas, sediment plumes, etc. in areas of concentrated flow or sedimentation raising bottom elevation of wetland. Guidance: Wetlands filled by sediment will have reduced capacity to store stormwater. Land use, ground slope, and erodibility characteristics of the soils affect potential sediment delivery. #18: Sediment delivery
#16: Percent vegetated #17: Roughness coefficient #18: Sediment delivery #16-18: Flow-Through Wetlands Direct stormwater inputs, mostly from residential. Darker areas are open-water. The remaining vegetation is assessed for its ability to slow water. Outline of wetland area.