Download

1 / 6
60 likes | 192 Vues
6.10 Make a table. Population Growth. At the beginning of the year 2000, the population of the United States was about 273.5 million. The rate of population growth was about 0.85% per year. If that rate continues, what will the population be at the beginning of 2010?

E N D
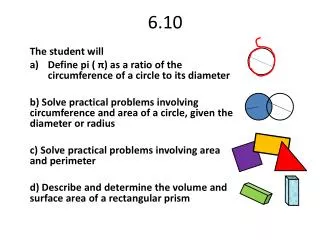
Population Growth • At the beginning of the year 2000, the population of the United States was about 273.5 million. The rate of population growth was about 0.85% per year. If that rate continues, what will the population be at the beginning of 2010? • What is important information? • What are we trying to find?
Make a plan • In this case a table can help us organize our data. • How can you find the increase in population from the beginning of 2000 to the end of that year? • How can you fins the population at the beginning of 2001? • Since the percent of increase is the same each year, will the population increase also be the same?
Think about it • Would you get the same answer if you multiplied 273.5 by .0085 and 10? • Why will this method give you an incorrect answer?
Homework • Page 340 • Problems 1-9 all